Okinawan vs Immigrants from Cabo Verde Male Poverty
COMPARE
Okinawan
Immigrants from Cabo Verde
Male Poverty
Male Poverty Comparison
Okinawans
Immigrants from Cabo Verde
10.7%
MALE POVERTY
87.6/ 100
METRIC RATING
118th/ 347
METRIC RANK
13.7%
MALE POVERTY
0.0/ 100
METRIC RATING
282nd/ 347
METRIC RANK
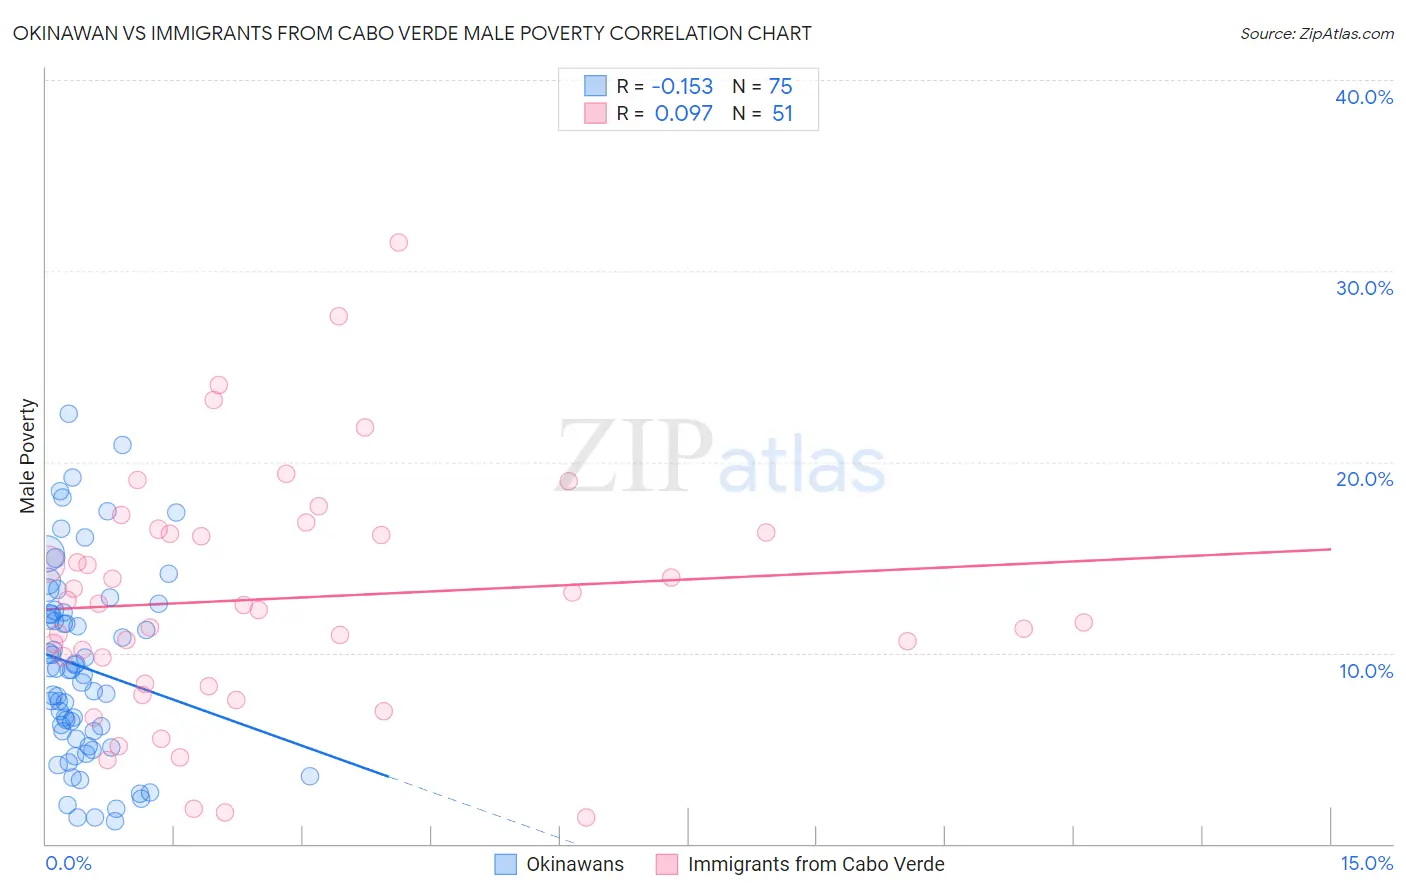
Okinawan vs Immigrants from Cabo Verde Male Poverty Correlation Chart
The statistical analysis conducted on geographies consisting of 73,717,243 people shows a poor negative correlation between the proportion of Okinawans and poverty level among males in the United States with a correlation coefficient (R) of -0.153 and weighted average of 10.7%. Similarly, the statistical analysis conducted on geographies consisting of 38,133,137 people shows a slight positive correlation between the proportion of Immigrants from Cabo Verde and poverty level among males in the United States with a correlation coefficient (R) of 0.097 and weighted average of 13.7%, a difference of 28.8%.
Male Poverty Correlation Summary
| Measurement | Okinawan | Immigrants from Cabo Verde |
| Minimum | 1.2% | 1.4% |
| Maximum | 22.5% | 31.5% |
| Range | 21.3% | 30.1% |
| Mean | 9.2% | 12.8% |
| Median | 9.1% | 12.5% |
| Interquartile 25% (IQ1) | 5.5% | 8.4% |
| Interquartile 75% (IQ3) | 12.1% | 16.3% |
| Interquartile Range (IQR) | 6.6% | 7.9% |
| Standard Deviation (Sample) | 5.0% | 6.3% |
| Standard Deviation (Population) | 4.9% | 6.2% |
Similar Demographics by Male Poverty
Demographics Similar to Okinawans by Male Poverty
In terms of male poverty, the demographic groups most similar to Okinawans are Immigrants from Hungary (10.7%, a difference of 0.010%), Immigrants from South Eastern Asia (10.6%, a difference of 0.11%), Immigrants from China (10.7%, a difference of 0.11%), Sri Lankan (10.6%, a difference of 0.12%), and Peruvian (10.7%, a difference of 0.12%).
| Demographics | Rating | Rank | Male Poverty |
| Immigrants | Argentina | 89.8 /100 | #111 | Excellent 10.6% |
| Immigrants | Turkey | 89.5 /100 | #112 | Excellent 10.6% |
| Palestinians | 89.1 /100 | #113 | Excellent 10.6% |
| Immigrants | Brazil | 89.0 /100 | #114 | Excellent 10.6% |
| Immigrants | Russia | 88.6 /100 | #115 | Excellent 10.6% |
| Sri Lankans | 88.1 /100 | #116 | Excellent 10.6% |
| Immigrants | South Eastern Asia | 88.1 /100 | #117 | Excellent 10.6% |
| Okinawans | 87.6 /100 | #118 | Excellent 10.7% |
| Immigrants | Hungary | 87.6 /100 | #119 | Excellent 10.7% |
| Immigrants | China | 87.1 /100 | #120 | Excellent 10.7% |
| Peruvians | 87.1 /100 | #121 | Excellent 10.7% |
| Native Hawaiians | 87.0 /100 | #122 | Excellent 10.7% |
| South Africans | 86.8 /100 | #123 | Excellent 10.7% |
| French | 86.7 /100 | #124 | Excellent 10.7% |
| Immigrants | Norway | 86.0 /100 | #125 | Excellent 10.7% |
Demographics Similar to Immigrants from Cabo Verde by Male Poverty
In terms of male poverty, the demographic groups most similar to Immigrants from Cabo Verde are Comanche (13.8%, a difference of 0.20%), Immigrants from Haiti (13.8%, a difference of 0.21%), West Indian (13.8%, a difference of 0.23%), Shoshone (13.8%, a difference of 0.26%), and Yaqui (13.7%, a difference of 0.27%).
| Demographics | Rating | Rank | Male Poverty |
| Barbadians | 0.0 /100 | #275 | Tragic 13.6% |
| Immigrants | Latin America | 0.0 /100 | #276 | Tragic 13.6% |
| Bangladeshis | 0.0 /100 | #277 | Tragic 13.6% |
| Belizeans | 0.0 /100 | #278 | Tragic 13.6% |
| Haitians | 0.0 /100 | #279 | Tragic 13.7% |
| Mexicans | 0.0 /100 | #280 | Tragic 13.7% |
| Yaqui | 0.0 /100 | #281 | Tragic 13.7% |
| Immigrants | Cabo Verde | 0.0 /100 | #282 | Tragic 13.7% |
| Comanche | 0.0 /100 | #283 | Tragic 13.8% |
| Immigrants | Haiti | 0.0 /100 | #284 | Tragic 13.8% |
| West Indians | 0.0 /100 | #285 | Tragic 13.8% |
| Shoshone | 0.0 /100 | #286 | Tragic 13.8% |
| Immigrants | Barbados | 0.0 /100 | #287 | Tragic 13.8% |
| Immigrants | St. Vincent and the Grenadines | 0.0 /100 | #288 | Tragic 13.8% |
| Guatemalans | 0.0 /100 | #289 | Tragic 13.8% |