Lebanese vs Immigrants from Cabo Verde Male Poverty
COMPARE
Lebanese
Immigrants from Cabo Verde
Male Poverty
Male Poverty Comparison
Lebanese
Immigrants from Cabo Verde
11.2%
MALE POVERTY
45.6/ 100
METRIC RATING
177th/ 347
METRIC RANK
13.7%
MALE POVERTY
0.0/ 100
METRIC RATING
282nd/ 347
METRIC RANK
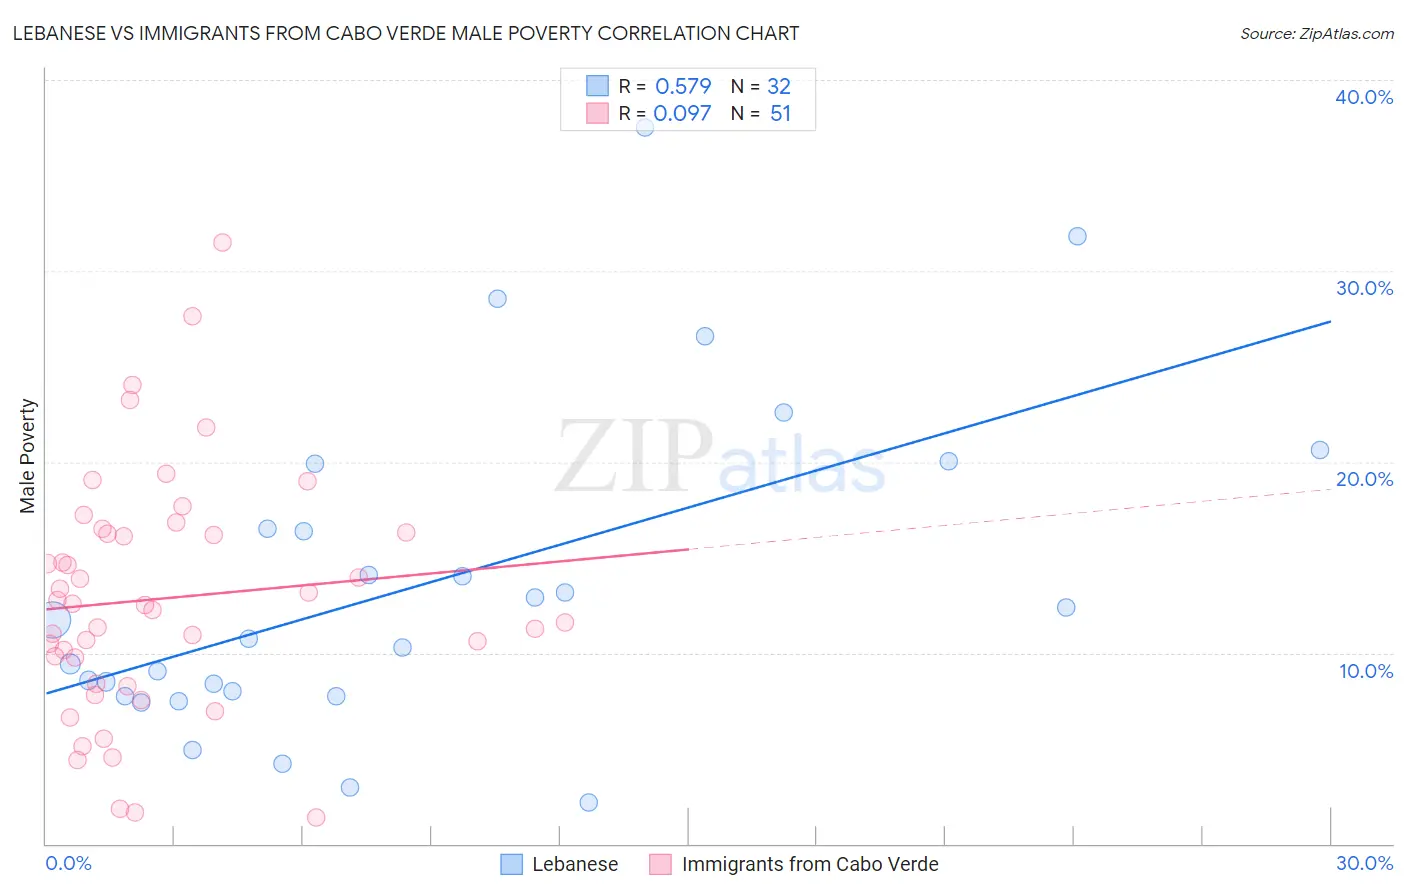
Lebanese vs Immigrants from Cabo Verde Male Poverty Correlation Chart
The statistical analysis conducted on geographies consisting of 401,187,213 people shows a substantial positive correlation between the proportion of Lebanese and poverty level among males in the United States with a correlation coefficient (R) of 0.579 and weighted average of 11.2%. Similarly, the statistical analysis conducted on geographies consisting of 38,133,137 people shows a slight positive correlation between the proportion of Immigrants from Cabo Verde and poverty level among males in the United States with a correlation coefficient (R) of 0.097 and weighted average of 13.7%, a difference of 22.2%.
Male Poverty Correlation Summary
| Measurement | Lebanese | Immigrants from Cabo Verde |
| Minimum | 2.1% | 1.4% |
| Maximum | 37.5% | 31.5% |
| Range | 35.4% | 30.1% |
| Mean | 13.6% | 12.8% |
| Median | 11.2% | 12.5% |
| Interquartile 25% (IQ1) | 7.9% | 8.4% |
| Interquartile 75% (IQ3) | 18.2% | 16.3% |
| Interquartile Range (IQR) | 10.3% | 7.9% |
| Standard Deviation (Sample) | 8.5% | 6.3% |
| Standard Deviation (Population) | 8.4% | 6.2% |
Similar Demographics by Male Poverty
Demographics Similar to Lebanese by Male Poverty
In terms of male poverty, the demographic groups most similar to Lebanese are Immigrants from Fiji (11.2%, a difference of 0.040%), Immigrants from Cameroon (11.2%, a difference of 0.11%), Celtic (11.2%, a difference of 0.18%), Immigrants from Oceania (11.2%, a difference of 0.43%), and Pennsylvania German (11.2%, a difference of 0.47%).
| Demographics | Rating | Rank | Male Poverty |
| South Americans | 53.8 /100 | #170 | Average 11.1% |
| Uruguayans | 51.0 /100 | #171 | Average 11.2% |
| Immigrants | Ethiopia | 50.7 /100 | #172 | Average 11.2% |
| Pennsylvania Germans | 50.5 /100 | #173 | Average 11.2% |
| Immigrants | Oceania | 50.0 /100 | #174 | Average 11.2% |
| Celtics | 47.5 /100 | #175 | Average 11.2% |
| Immigrants | Fiji | 46.0 /100 | #176 | Average 11.2% |
| Lebanese | 45.6 /100 | #177 | Average 11.2% |
| Immigrants | Cameroon | 44.5 /100 | #178 | Average 11.2% |
| Immigrants | Syria | 40.3 /100 | #179 | Average 11.3% |
| Immigrants | Morocco | 40.1 /100 | #180 | Average 11.3% |
| Immigrants | Costa Rica | 39.5 /100 | #181 | Fair 11.3% |
| Mongolians | 39.0 /100 | #182 | Fair 11.3% |
| Kenyans | 38.4 /100 | #183 | Fair 11.3% |
| Immigrants | South America | 36.9 /100 | #184 | Fair 11.3% |
Demographics Similar to Immigrants from Cabo Verde by Male Poverty
In terms of male poverty, the demographic groups most similar to Immigrants from Cabo Verde are Comanche (13.8%, a difference of 0.20%), Immigrants from Haiti (13.8%, a difference of 0.21%), West Indian (13.8%, a difference of 0.23%), Shoshone (13.8%, a difference of 0.26%), and Yaqui (13.7%, a difference of 0.27%).
| Demographics | Rating | Rank | Male Poverty |
| Barbadians | 0.0 /100 | #275 | Tragic 13.6% |
| Immigrants | Latin America | 0.0 /100 | #276 | Tragic 13.6% |
| Bangladeshis | 0.0 /100 | #277 | Tragic 13.6% |
| Belizeans | 0.0 /100 | #278 | Tragic 13.6% |
| Haitians | 0.0 /100 | #279 | Tragic 13.7% |
| Mexicans | 0.0 /100 | #280 | Tragic 13.7% |
| Yaqui | 0.0 /100 | #281 | Tragic 13.7% |
| Immigrants | Cabo Verde | 0.0 /100 | #282 | Tragic 13.7% |
| Comanche | 0.0 /100 | #283 | Tragic 13.8% |
| Immigrants | Haiti | 0.0 /100 | #284 | Tragic 13.8% |
| West Indians | 0.0 /100 | #285 | Tragic 13.8% |
| Shoshone | 0.0 /100 | #286 | Tragic 13.8% |
| Immigrants | Barbados | 0.0 /100 | #287 | Tragic 13.8% |
| Immigrants | St. Vincent and the Grenadines | 0.0 /100 | #288 | Tragic 13.8% |
| Guatemalans | 0.0 /100 | #289 | Tragic 13.8% |