Okinawan vs Immigrants from Guyana Male Poverty
COMPARE
Okinawan
Immigrants from Guyana
Male Poverty
Male Poverty Comparison
Okinawans
Immigrants from Guyana
10.7%
MALE POVERTY
87.6/ 100
METRIC RATING
118th/ 347
METRIC RANK
13.2%
MALE POVERTY
0.1/ 100
METRIC RATING
266th/ 347
METRIC RANK
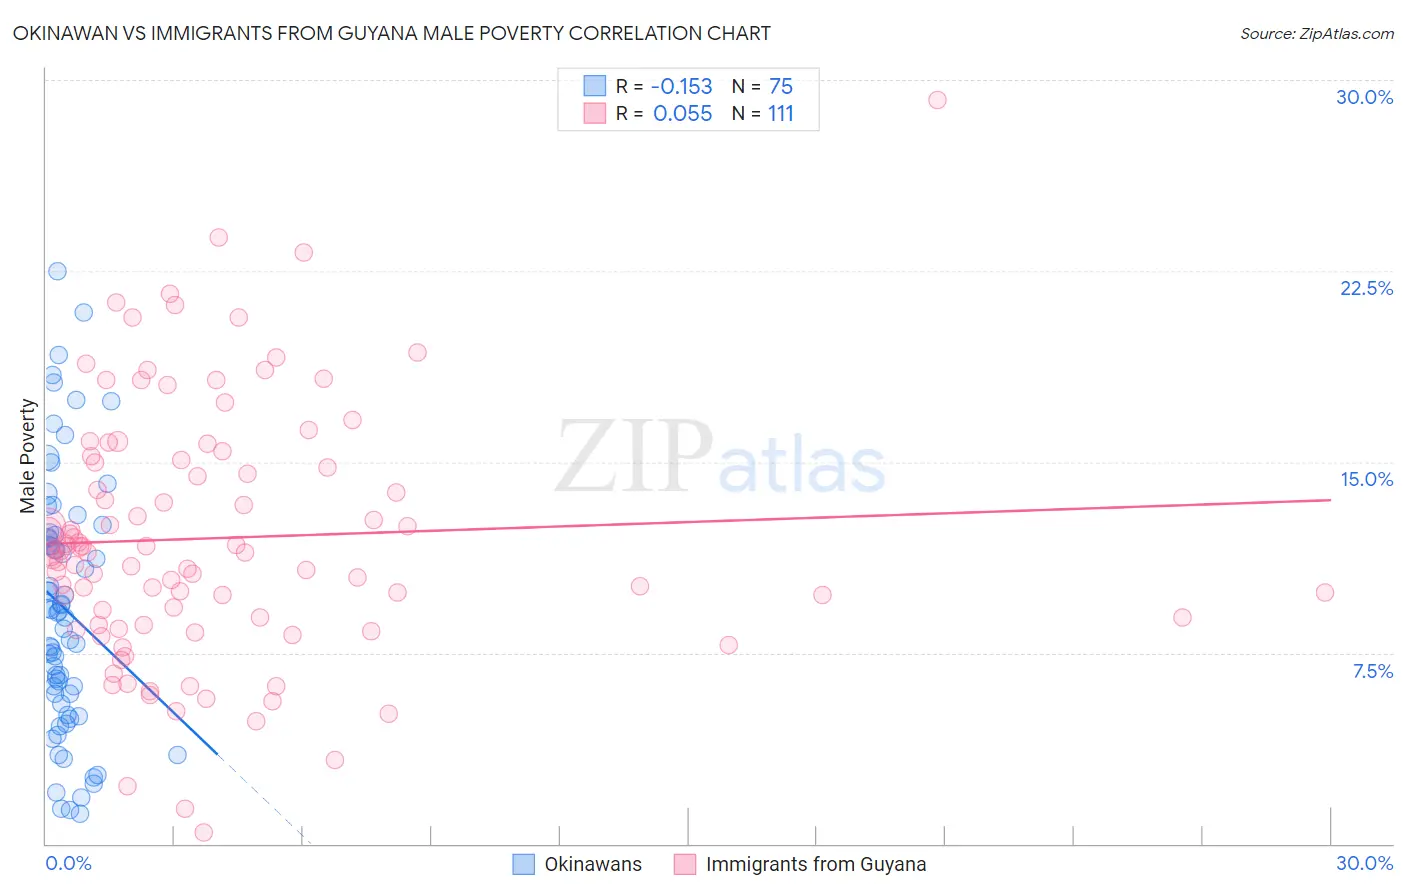
Okinawan vs Immigrants from Guyana Male Poverty Correlation Chart
The statistical analysis conducted on geographies consisting of 73,717,243 people shows a poor negative correlation between the proportion of Okinawans and poverty level among males in the United States with a correlation coefficient (R) of -0.153 and weighted average of 10.7%. Similarly, the statistical analysis conducted on geographies consisting of 183,559,274 people shows a slight positive correlation between the proportion of Immigrants from Guyana and poverty level among males in the United States with a correlation coefficient (R) of 0.055 and weighted average of 13.2%, a difference of 24.2%.
Male Poverty Correlation Summary
| Measurement | Okinawan | Immigrants from Guyana |
| Minimum | 1.2% | 0.44% |
| Maximum | 22.5% | 29.2% |
| Range | 21.3% | 28.8% |
| Mean | 9.2% | 12.0% |
| Median | 9.1% | 11.4% |
| Interquartile 25% (IQ1) | 5.5% | 8.6% |
| Interquartile 75% (IQ3) | 12.1% | 15.1% |
| Interquartile Range (IQR) | 6.6% | 6.5% |
| Standard Deviation (Sample) | 5.0% | 5.0% |
| Standard Deviation (Population) | 4.9% | 5.0% |
Similar Demographics by Male Poverty
Demographics Similar to Okinawans by Male Poverty
In terms of male poverty, the demographic groups most similar to Okinawans are Immigrants from Hungary (10.7%, a difference of 0.010%), Immigrants from South Eastern Asia (10.6%, a difference of 0.11%), Immigrants from China (10.7%, a difference of 0.11%), Sri Lankan (10.6%, a difference of 0.12%), and Peruvian (10.7%, a difference of 0.12%).
| Demographics | Rating | Rank | Male Poverty |
| Immigrants | Argentina | 89.8 /100 | #111 | Excellent 10.6% |
| Immigrants | Turkey | 89.5 /100 | #112 | Excellent 10.6% |
| Palestinians | 89.1 /100 | #113 | Excellent 10.6% |
| Immigrants | Brazil | 89.0 /100 | #114 | Excellent 10.6% |
| Immigrants | Russia | 88.6 /100 | #115 | Excellent 10.6% |
| Sri Lankans | 88.1 /100 | #116 | Excellent 10.6% |
| Immigrants | South Eastern Asia | 88.1 /100 | #117 | Excellent 10.6% |
| Okinawans | 87.6 /100 | #118 | Excellent 10.7% |
| Immigrants | Hungary | 87.6 /100 | #119 | Excellent 10.7% |
| Immigrants | China | 87.1 /100 | #120 | Excellent 10.7% |
| Peruvians | 87.1 /100 | #121 | Excellent 10.7% |
| Native Hawaiians | 87.0 /100 | #122 | Excellent 10.7% |
| South Africans | 86.8 /100 | #123 | Excellent 10.7% |
| French | 86.7 /100 | #124 | Excellent 10.7% |
| Immigrants | Norway | 86.0 /100 | #125 | Excellent 10.7% |
Demographics Similar to Immigrants from Guyana by Male Poverty
In terms of male poverty, the demographic groups most similar to Immigrants from Guyana are Immigrants from Jamaica (13.3%, a difference of 0.11%), Jamaican (13.2%, a difference of 0.14%), Subsaharan African (13.3%, a difference of 0.14%), Iroquois (13.2%, a difference of 0.16%), and Guyanese (13.3%, a difference of 0.36%).
| Demographics | Rating | Rank | Male Poverty |
| Cherokee | 0.1 /100 | #259 | Tragic 13.1% |
| Ottawa | 0.1 /100 | #260 | Tragic 13.1% |
| Trinidadians and Tobagonians | 0.1 /100 | #261 | Tragic 13.1% |
| Spanish American Indians | 0.1 /100 | #262 | Tragic 13.1% |
| Central Americans | 0.1 /100 | #263 | Tragic 13.2% |
| Iroquois | 0.1 /100 | #264 | Tragic 13.2% |
| Jamaicans | 0.1 /100 | #265 | Tragic 13.2% |
| Immigrants | Guyana | 0.1 /100 | #266 | Tragic 13.2% |
| Immigrants | Jamaica | 0.1 /100 | #267 | Tragic 13.3% |
| Sub-Saharan Africans | 0.1 /100 | #268 | Tragic 13.3% |
| Guyanese | 0.0 /100 | #269 | Tragic 13.3% |
| Cree | 0.0 /100 | #270 | Tragic 13.3% |
| Spanish Americans | 0.0 /100 | #271 | Tragic 13.4% |
| Immigrants | Bahamas | 0.0 /100 | #272 | Tragic 13.5% |
| Chickasaw | 0.0 /100 | #273 | Tragic 13.5% |