Cajun vs Immigrants from Cabo Verde Male Poverty
COMPARE
Cajun
Immigrants from Cabo Verde
Male Poverty
Male Poverty Comparison
Cajuns
Immigrants from Cabo Verde
13.9%
MALE POVERTY
0.0/ 100
METRIC RATING
296th/ 347
METRIC RANK
13.7%
MALE POVERTY
0.0/ 100
METRIC RATING
282nd/ 347
METRIC RANK
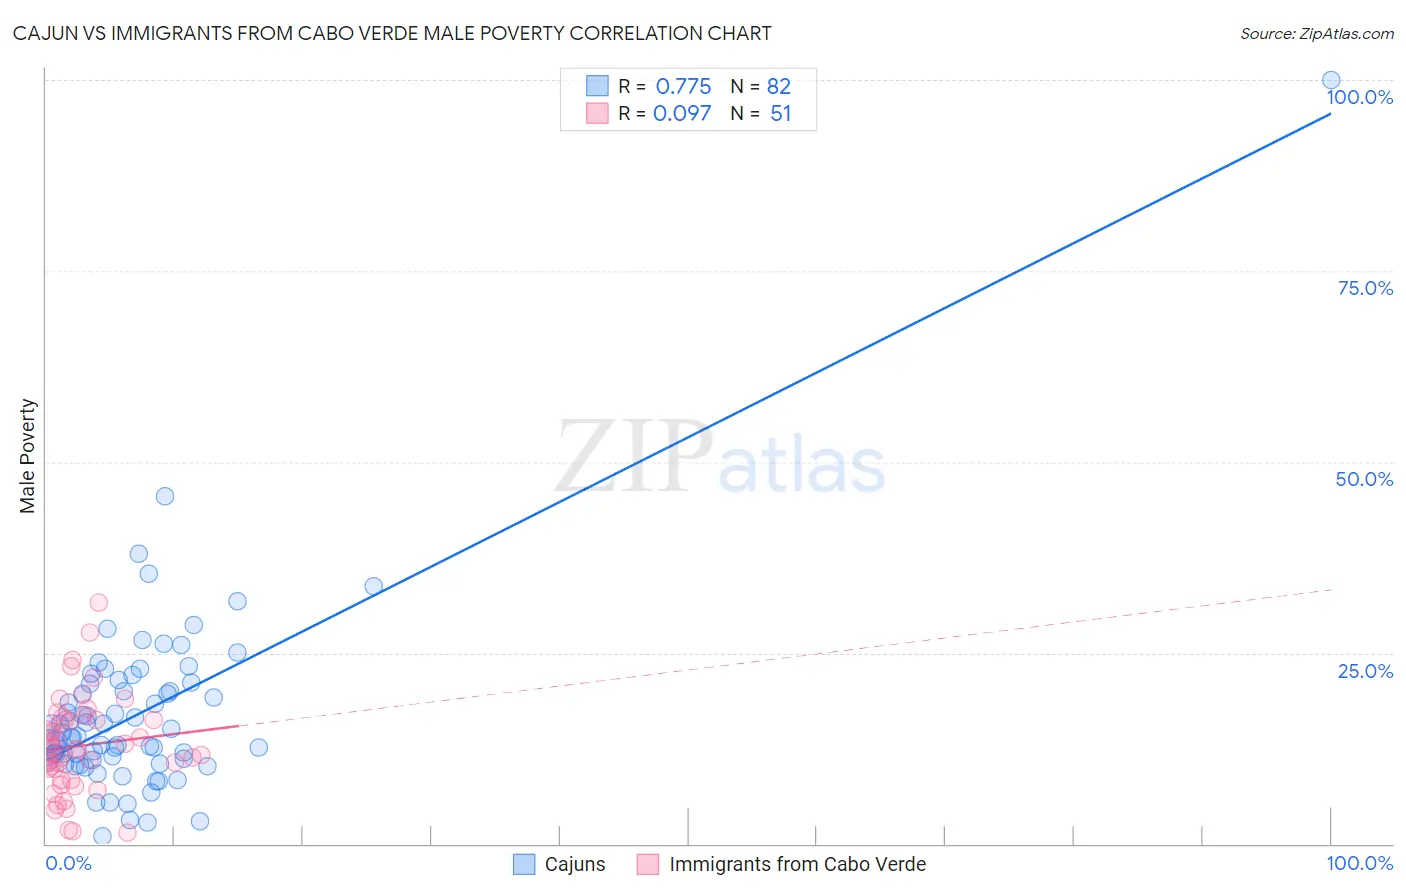
Cajun vs Immigrants from Cabo Verde Male Poverty Correlation Chart
The statistical analysis conducted on geographies consisting of 149,683,084 people shows a strong positive correlation between the proportion of Cajuns and poverty level among males in the United States with a correlation coefficient (R) of 0.775 and weighted average of 13.9%. Similarly, the statistical analysis conducted on geographies consisting of 38,133,137 people shows a slight positive correlation between the proportion of Immigrants from Cabo Verde and poverty level among males in the United States with a correlation coefficient (R) of 0.097 and weighted average of 13.7%, a difference of 1.3%.
Male Poverty Correlation Summary
| Measurement | Cajun | Immigrants from Cabo Verde |
| Minimum | 0.97% | 1.4% |
| Maximum | 100.0% | 31.5% |
| Range | 99.0% | 30.1% |
| Mean | 17.0% | 12.8% |
| Median | 13.9% | 12.5% |
| Interquartile 25% (IQ1) | 10.9% | 8.4% |
| Interquartile 75% (IQ3) | 20.9% | 16.3% |
| Interquartile Range (IQR) | 10.0% | 7.9% |
| Standard Deviation (Sample) | 12.4% | 6.3% |
| Standard Deviation (Population) | 12.3% | 6.2% |
Demographics Similar to Cajuns and Immigrants from Cabo Verde by Male Poverty
In terms of male poverty, the demographic groups most similar to Cajuns are Immigrants from Central America (13.9%, a difference of 0.11%), Hispanic or Latino (13.9%, a difference of 0.40%), Immigrants from Belize (13.8%, a difference of 0.45%), Indonesian (13.8%, a difference of 0.46%), and Vietnamese (13.8%, a difference of 0.63%). Similarly, the demographic groups most similar to Immigrants from Cabo Verde are Comanche (13.8%, a difference of 0.20%), Immigrants from Haiti (13.8%, a difference of 0.21%), West Indian (13.8%, a difference of 0.23%), Shoshone (13.8%, a difference of 0.26%), and Yaqui (13.7%, a difference of 0.27%).
| Demographics | Rating | Rank | Male Poverty |
| Haitians | 0.0 /100 | #279 | Tragic 13.7% |
| Mexicans | 0.0 /100 | #280 | Tragic 13.7% |
| Yaqui | 0.0 /100 | #281 | Tragic 13.7% |
| Immigrants | Cabo Verde | 0.0 /100 | #282 | Tragic 13.7% |
| Comanche | 0.0 /100 | #283 | Tragic 13.8% |
| Immigrants | Haiti | 0.0 /100 | #284 | Tragic 13.8% |
| West Indians | 0.0 /100 | #285 | Tragic 13.8% |
| Shoshone | 0.0 /100 | #286 | Tragic 13.8% |
| Immigrants | Barbados | 0.0 /100 | #287 | Tragic 13.8% |
| Immigrants | St. Vincent and the Grenadines | 0.0 /100 | #288 | Tragic 13.8% |
| Guatemalans | 0.0 /100 | #289 | Tragic 13.8% |
| Immigrants | Zaire | 0.0 /100 | #290 | Tragic 13.8% |
| Vietnamese | 0.0 /100 | #291 | Tragic 13.8% |
| Indonesians | 0.0 /100 | #292 | Tragic 13.8% |
| Immigrants | Belize | 0.0 /100 | #293 | Tragic 13.8% |
| Hispanics or Latinos | 0.0 /100 | #294 | Tragic 13.9% |
| Immigrants | Central America | 0.0 /100 | #295 | Tragic 13.9% |
| Cajuns | 0.0 /100 | #296 | Tragic 13.9% |
| Inupiat | 0.0 /100 | #297 | Tragic 14.0% |
| Blackfeet | 0.0 /100 | #298 | Tragic 14.0% |
| Immigrants | Guatemala | 0.0 /100 | #299 | Tragic 14.0% |