Scotch-Irish vs Immigrants from Cabo Verde Male Poverty

COMPARE

Scotch-Irish
Race
Ancestry
AfghanAfricanAlaska NativeAlaskan AthabascanAlbanianAleutAlsatianAmericanApacheArabArapahoArgentineanArmenianAssyrian/Chaldean/SyriacAustralianAustrianBahamianBangladeshiBarbadianBasqueBelgianBelizeanBermudanBhutaneseBlackfeetBolivianBrazilianBritishBritish West IndianBulgarianBurmeseCajunCambodianCanadianCape VerdeanCarpatho RusynCelticCentral AmericanCentral American IndianCherokeeCheyenneChickasawChileanChineseChippewaChoctawColombianColvilleComancheCosta RicanCreeCreekCroatianCrowCubanCypriotCzechCzechoslovakianDanishDelawareDominicanDutchDutch West IndianEastern EuropeanEcuadorianEgyptianEnglishEstonianEthiopianEuropeanFijianFilipinoFinnishFrenchFrench American IndianFrench CanadianGermanGerman RussianGhanaianGreekGuamanian/ChamorroGuatemalanGuyaneseHaitianHmongHonduranHopiHoumaHungarianIcelanderIndian (Asian)IndonesianInupiatIranianIraqiIrishIroquoisIsraeliItalianJamaicanJapaneseJordanianKenyanKiowaKoreanLaotianLatvianLebaneseLiberianLithuanianLumbeeLuxembourgerMacedonianMalaysianMalteseMarshalleseMenomineeMexicanMexican American IndianMongolianMoroccanNative HawaiianNavajoNepaleseNew ZealanderNicaraguanNigerianNorthern EuropeanNorwegianOkinawanOsageOttawaPaiutePakistaniPalestinianPanamanianParaguayanPennsylvania GermanPeruvianPimaPolishPortuguesePotawatomiPuebloPuerto RicanPuget Sound SalishRomanianRussianSalvadoranSamoanScandinavianScotch-IrishScottishSeminoleSenegaleseSerbianShoshoneSierra LeoneanSiouxSlavicSlovakSloveneSomaliSouth AfricanSouth AmericanSouth American IndianSoviet UnionSpaniardSpanishSpanish AmericanSpanish American IndianSri LankanSubsaharan AfricanSudaneseSwedishSwissSyrianTaiwaneseThaiTlingit-HaidaTohono O'OdhamTonganTrinidadian and TobagonianTsimshianTurkishU.S. Virgin IslanderUgandanUkrainianUruguayanUteVenezuelanVietnameseWelshWest IndianYakamaYaquiYugoslavianYumanYup'ikZimbabwean
Immigration
NonimmigrantsImmigrantsAfghanistanAfricaAlbaniaArgentinaArmeniaAsiaAustraliaAustriaBahamasBangladeshBarbadosBelarusBelgiumBelizeBoliviaBosnia and HerzegovinaBrazilBulgariaBurma/MyanmarCambodiaCameroonCanadaCaribbeanCentral AmericaChileChinaColombiaCongoCosta RicaCroatiaCubaCzechoslovakiaDenmarkDominicaDominican RepublicEastern AfricaEastern AsiaEastern EuropeEcuadorEgyptEl SalvadorEnglandEritreaEthiopiaEuropeFijiFranceGermanyGhanaGreeceGrenadaGuatemalaGuyanaHaitiHondurasHong KongHungaryIndiaIndonesiaIranIraqIrelandIsraelItalyJamaicaJapanJordanKazakhstanKenyaKoreaKuwaitLaosLatin AmericaLatviaLebanonLiberiaLithuaniaMalaysiaMexicoMicronesiaMiddle AfricaMoldovaMoroccoNepalNetherlandsNicaraguaNigeriaNorth AmericaNorth MacedoniaNorthern AfricaNorthern EuropeNorwayOceaniaPakistanPanamaPeruPhilippinesPolandPortugalRomaniaRussiaSaudi ArabiaScotlandSenegalSerbiaSierra LeoneSingaporeSomaliaSouth AfricaSouth AmericaSouth Central AsiaSouth Eastern AsiaSouthern EuropeSpainSri LankaSt. Vincent and the GrenadinesSudanSwedenSwitzerlandSyriaTaiwanThailandTrinidad and TobagoTurkeyUgandaUkraineUruguayUzbekistanVenezuelaVietnamWest IndiesWestern AfricaWestern AsiaWestern EuropeYemenZaireZimbabweAzores
Immigrants from Cabo Verde
Race
Ancestry
AfghanAfricanAlaska NativeAlaskan AthabascanAlbanianAleutAlsatianAmericanApacheArabArapahoArgentineanArmenianAssyrian/Chaldean/SyriacAustralianAustrianBahamianBangladeshiBarbadianBasqueBelgianBelizeanBermudanBhutaneseBlackfeetBolivianBrazilianBritishBritish West IndianBulgarianBurmeseCajunCambodianCanadianCape VerdeanCarpatho RusynCelticCentral AmericanCentral American IndianCherokeeCheyenneChickasawChileanChineseChippewaChoctawColombianColvilleComancheCosta RicanCreeCreekCroatianCrowCubanCypriotCzechCzechoslovakianDanishDelawareDominicanDutchDutch West IndianEastern EuropeanEcuadorianEgyptianEnglishEstonianEthiopianEuropeanFijianFilipinoFinnishFrenchFrench American IndianFrench CanadianGermanGerman RussianGhanaianGreekGuamanian/ChamorroGuatemalanGuyaneseHaitianHmongHonduranHopiHoumaHungarianIcelanderIndian (Asian)IndonesianInupiatIranianIraqiIrishIroquoisIsraeliItalianJamaicanJapaneseJordanianKenyanKiowaKoreanLaotianLatvianLebaneseLiberianLithuanianLumbeeLuxembourgerMacedonianMalaysianMalteseMarshalleseMenomineeMexicanMexican American IndianMongolianMoroccanNative HawaiianNavajoNepaleseNew ZealanderNicaraguanNigerianNorthern EuropeanNorwegianOkinawanOsageOttawaPaiutePakistaniPalestinianPanamanianParaguayanPennsylvania GermanPeruvianPimaPolishPortuguesePotawatomiPuebloPuerto RicanPuget Sound SalishRomanianRussianSalvadoranSamoanScandinavianScottishSeminoleSenegaleseSerbianShoshoneSierra LeoneanSiouxSlavicSlovakSloveneSomaliSouth AfricanSouth AmericanSouth American IndianSoviet UnionSpaniardSpanishSpanish AmericanSpanish American IndianSri LankanSubsaharan AfricanSudaneseSwedishSwissSyrianTaiwaneseThaiTlingit-HaidaTohono O'OdhamTonganTrinidadian and TobagonianTsimshianTurkishU.S. Virgin IslanderUgandanUkrainianUruguayanUteVenezuelanVietnameseWelshWest IndianYakamaYaquiYugoslavianYumanYup'ikZimbabwean
Immigration
NonimmigrantsImmigrantsAfghanistanAfricaAlbaniaArgentinaArmeniaAsiaAustraliaAustriaBahamasBangladeshBarbadosBelarusBelgiumBelizeBoliviaBosnia and HerzegovinaBrazilBulgariaBurma/MyanmarCabo VerdeCambodiaCameroonCanadaCaribbeanCentral AmericaChileChinaColombiaCongoCosta RicaCroatiaCubaCzechoslovakiaDenmarkDominicaDominican RepublicEastern AfricaEastern AsiaEastern EuropeEcuadorEgyptEl SalvadorEnglandEritreaEthiopiaEuropeFijiFranceGermanyGhanaGreeceGrenadaGuatemalaGuyanaHaitiHondurasHong KongHungaryIndiaIndonesiaIranIraqIrelandIsraelItalyJamaicaJapanJordanKazakhstanKenyaKoreaKuwaitLaosLatin AmericaLatviaLebanonLiberiaLithuaniaMalaysiaMexicoMicronesiaMiddle AfricaMoldovaMoroccoNepalNetherlandsNicaraguaNigeriaNorth AmericaNorth MacedoniaNorthern AfricaNorthern EuropeNorwayOceaniaPakistanPanamaPeruPhilippinesPolandPortugalRomaniaRussiaSaudi ArabiaScotlandSenegalSerbiaSierra LeoneSingaporeSomaliaSouth AfricaSouth AmericaSouth Central AsiaSouth Eastern AsiaSouthern EuropeSpainSri LankaSt. Vincent and the GrenadinesSudanSwedenSwitzerlandSyriaTaiwanThailandTrinidad and TobagoTurkeyUgandaUkraineUruguayUzbekistanVenezuelaVietnamWest IndiesWestern AfricaWestern AsiaWestern EuropeYemenZaireZimbabweAzores
Male Poverty
Income
Poverty
Unemployment
Labor Participation
Family Structure
Vehicle Availability
Education Level
Disability

Male Poverty Comparison

Scotch-Irish

Immigrants from Cabo Verde

Good
Tragic
11.0%
MALE POVERTY
63.7/ 100
METRIC RATING
157th/ 347
METRIC RANK
13.7%
MALE POVERTY
0.0/ 100
METRIC RATING
282nd/ 347
METRIC RANK

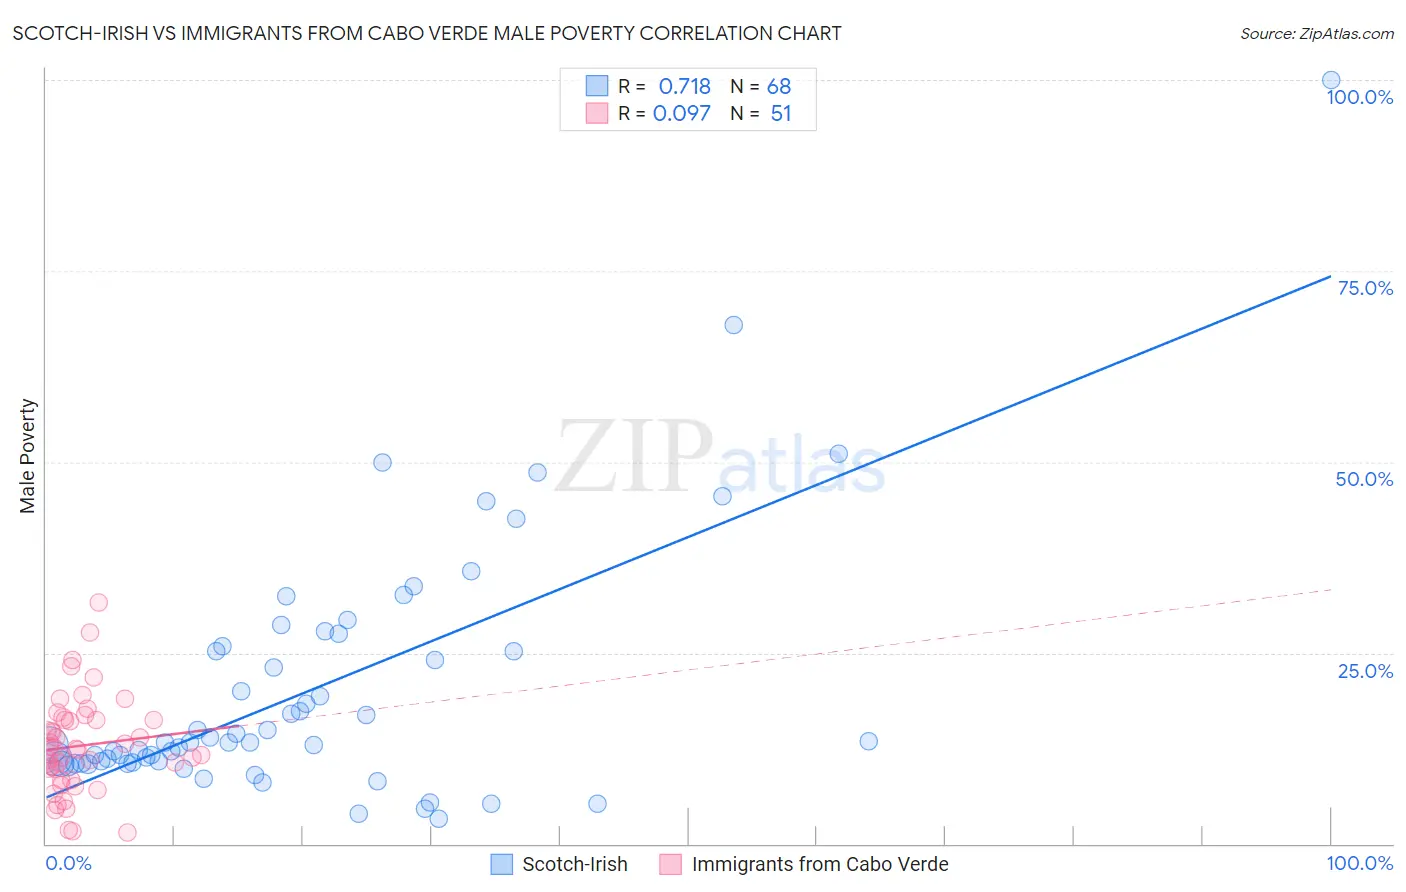
Scotch-Irish vs Immigrants from Cabo Verde Male Poverty Correlation Chart

The statistical analysis conducted on geographies consisting of 547,595,685 people shows a strong positive correlation between the proportion of Scotch-Irish and poverty level among males in the United States with a correlation coefficient (R) of 0.718 and weighted average of 11.0%. Similarly, the statistical analysis conducted on geographies consisting of 38,133,137 people shows a slight positive correlation between the proportion of Immigrants from Cabo Verde and poverty level among males in the United States with a correlation coefficient (R) of 0.097 and weighted average of 13.7%, a difference of 24.4%.
Scotch-Irish vs Immigrants from Cabo Verde Male Poverty

Male Poverty Correlation Summary

MeasurementScotch-IrishImmigrants from Cabo Verde
Minimum3.2%1.4%
Maximum100.0%31.5%
Range96.8%30.1%
Mean20.1%12.8%
Median13.3%12.5%
Interquartile 25% (IQ1)10.6%8.4%
Interquartile 75% (IQ3)25.5%16.3%
Interquartile Range (IQR)14.9%7.9%
Standard Deviation (Sample)16.5%6.3%
Standard Deviation (Population)16.4%6.2%

Similar Demographics by Male Poverty

Demographics Similar to Scotch-Irish by Male Poverty

In terms of male poverty, the demographic groups most similar to Scotch-Irish are Costa Rican (11.0%, a difference of 0.020%), Colombian (11.0%, a difference of 0.080%), Taiwanese (11.0%, a difference of 0.10%), Immigrants from Malaysia (11.0%, a difference of 0.11%), and Immigrants from Kazakhstan (11.0%, a difference of 0.12%).
DemographicsRating | RankMale Poverty
Guamanians/Chamorros
67.6
/100
|
#150
Good
11.0%
Venezuelans
67.4
/100
|
#151
Good
11.0%
Immigrants | Nepal
67.3
/100
|
#152
Good
11.0%
Immigrants | Bosnia and Herzegovina
65.2
/100
|
#153
Good
11.0%
Immigrants | Kazakhstan
64.8
/100
|
#154
Good
11.0%
Immigrants | Malaysia
64.7
/100
|
#155
Good
11.0%
Costa Ricans
63.9
/100
|
#156
Good
11.0%
Scotch-Irish
63.7
/100
|
#157
Good
11.0%
Colombians
63.0
/100
|
#158
Good
11.0%
Taiwanese
62.7
/100
|
#159
Good
11.0%
Soviet Union
60.3
/100
|
#160
Good
11.1%
Immigrants | Northern Africa
59.7
/100
|
#161
Average
11.1%
Immigrants | Chile
57.4
/100
|
#162
Average
11.1%
Whites/Caucasians
56.7
/100
|
#163
Average
11.1%
Ethiopians
56.7
/100
|
#164
Average
11.1%

Demographics Similar to Immigrants from Cabo Verde by Male Poverty

In terms of male poverty, the demographic groups most similar to Immigrants from Cabo Verde are Comanche (13.8%, a difference of 0.20%), Immigrants from Haiti (13.8%, a difference of 0.21%), West Indian (13.8%, a difference of 0.23%), Shoshone (13.8%, a difference of 0.26%), and Yaqui (13.7%, a difference of 0.27%).
DemographicsRating | RankMale Poverty
Barbadians
0.0
/100
|
#275
Tragic
13.6%
Immigrants | Latin America
0.0
/100
|
#276
Tragic
13.6%
Bangladeshis
0.0
/100
|
#277
Tragic
13.6%
Belizeans
0.0
/100
|
#278
Tragic
13.6%
Haitians
0.0
/100
|
#279
Tragic
13.7%
Mexicans
0.0
/100
|
#280
Tragic
13.7%
Yaqui
0.0
/100
|
#281
Tragic
13.7%
Immigrants | Cabo Verde
0.0
/100
|
#282
Tragic
13.7%
Comanche
0.0
/100
|
#283
Tragic
13.8%
Immigrants | Haiti
0.0
/100
|
#284
Tragic
13.8%
West Indians
0.0
/100
|
#285
Tragic
13.8%
Shoshone
0.0
/100
|
#286
Tragic
13.8%
Immigrants | Barbados
0.0
/100
|
#287
Tragic
13.8%
Immigrants | St. Vincent and the Grenadines
0.0
/100
|
#288
Tragic
13.8%
Guatemalans
0.0
/100
|
#289
Tragic
13.8%