Ghanaian vs Immigrants from Cabo Verde Male Poverty
COMPARE
Ghanaian
Immigrants from Cabo Verde
Male Poverty
Male Poverty Comparison
Ghanaians
Immigrants from Cabo Verde
12.7%
MALE POVERTY
0.4/ 100
METRIC RATING
239th/ 347
METRIC RANK
13.7%
MALE POVERTY
0.0/ 100
METRIC RATING
282nd/ 347
METRIC RANK
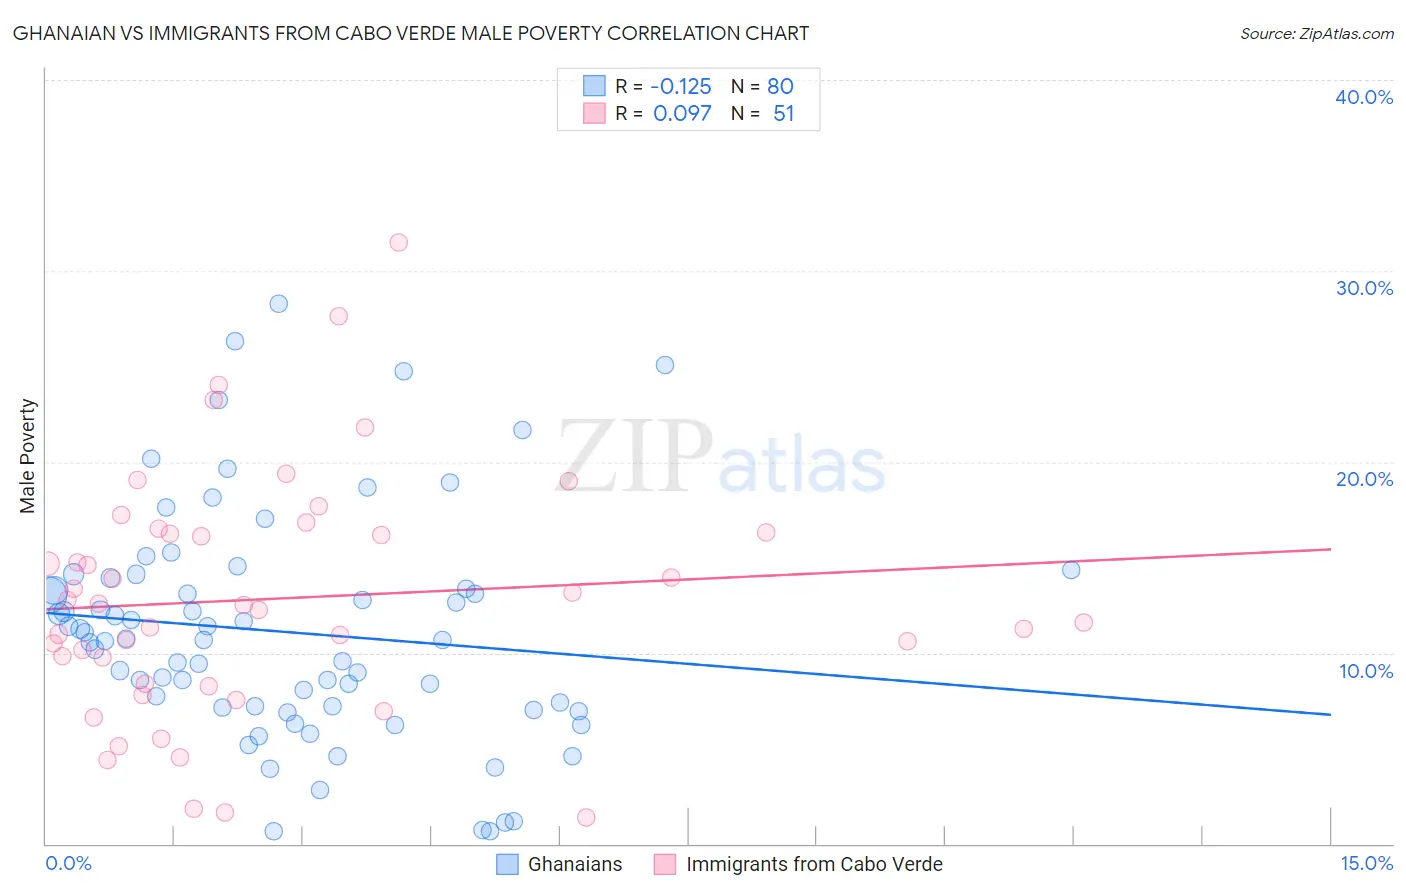
Ghanaian vs Immigrants from Cabo Verde Male Poverty Correlation Chart
The statistical analysis conducted on geographies consisting of 190,493,527 people shows a poor negative correlation between the proportion of Ghanaians and poverty level among males in the United States with a correlation coefficient (R) of -0.125 and weighted average of 12.7%. Similarly, the statistical analysis conducted on geographies consisting of 38,133,137 people shows a slight positive correlation between the proportion of Immigrants from Cabo Verde and poverty level among males in the United States with a correlation coefficient (R) of 0.097 and weighted average of 13.7%, a difference of 8.2%.
Male Poverty Correlation Summary
| Measurement | Ghanaian | Immigrants from Cabo Verde |
| Minimum | 0.62% | 1.4% |
| Maximum | 28.3% | 31.5% |
| Range | 27.6% | 30.1% |
| Mean | 11.1% | 12.8% |
| Median | 10.7% | 12.5% |
| Interquartile 25% (IQ1) | 7.2% | 8.4% |
| Interquartile 75% (IQ3) | 13.6% | 16.3% |
| Interquartile Range (IQR) | 6.5% | 7.9% |
| Standard Deviation (Sample) | 6.0% | 6.3% |
| Standard Deviation (Population) | 5.9% | 6.2% |
Similar Demographics by Male Poverty
Demographics Similar to Ghanaians by Male Poverty
In terms of male poverty, the demographic groups most similar to Ghanaians are Ecuadorian (12.7%, a difference of 0.0%), French American Indian (12.7%, a difference of 0.030%), Immigrants from Saudi Arabia (12.7%, a difference of 0.080%), Immigrants from Middle Africa (12.7%, a difference of 0.27%), and Immigrants from Laos (12.6%, a difference of 0.33%).
| Demographics | Rating | Rank | Male Poverty |
| Nicaraguans | 0.6 /100 | #232 | Tragic 12.6% |
| Fijians | 0.6 /100 | #233 | Tragic 12.6% |
| Immigrants | Armenia | 0.6 /100 | #234 | Tragic 12.6% |
| Immigrants | Laos | 0.5 /100 | #235 | Tragic 12.6% |
| Immigrants | Saudi Arabia | 0.4 /100 | #236 | Tragic 12.7% |
| French American Indians | 0.4 /100 | #237 | Tragic 12.7% |
| Ecuadorians | 0.4 /100 | #238 | Tragic 12.7% |
| Ghanaians | 0.4 /100 | #239 | Tragic 12.7% |
| Immigrants | Middle Africa | 0.4 /100 | #240 | Tragic 12.7% |
| Sudanese | 0.3 /100 | #241 | Tragic 12.8% |
| Nepalese | 0.3 /100 | #242 | Tragic 12.8% |
| Alaskan Athabascans | 0.3 /100 | #243 | Tragic 12.8% |
| Tsimshian | 0.3 /100 | #244 | Tragic 12.8% |
| Liberians | 0.3 /100 | #245 | Tragic 12.8% |
| Immigrants | El Salvador | 0.2 /100 | #246 | Tragic 12.8% |
Demographics Similar to Immigrants from Cabo Verde by Male Poverty
In terms of male poverty, the demographic groups most similar to Immigrants from Cabo Verde are Comanche (13.8%, a difference of 0.20%), Immigrants from Haiti (13.8%, a difference of 0.21%), West Indian (13.8%, a difference of 0.23%), Shoshone (13.8%, a difference of 0.26%), and Yaqui (13.7%, a difference of 0.27%).
| Demographics | Rating | Rank | Male Poverty |
| Barbadians | 0.0 /100 | #275 | Tragic 13.6% |
| Immigrants | Latin America | 0.0 /100 | #276 | Tragic 13.6% |
| Bangladeshis | 0.0 /100 | #277 | Tragic 13.6% |
| Belizeans | 0.0 /100 | #278 | Tragic 13.6% |
| Haitians | 0.0 /100 | #279 | Tragic 13.7% |
| Mexicans | 0.0 /100 | #280 | Tragic 13.7% |
| Yaqui | 0.0 /100 | #281 | Tragic 13.7% |
| Immigrants | Cabo Verde | 0.0 /100 | #282 | Tragic 13.7% |
| Comanche | 0.0 /100 | #283 | Tragic 13.8% |
| Immigrants | Haiti | 0.0 /100 | #284 | Tragic 13.8% |
| West Indians | 0.0 /100 | #285 | Tragic 13.8% |
| Shoshone | 0.0 /100 | #286 | Tragic 13.8% |
| Immigrants | Barbados | 0.0 /100 | #287 | Tragic 13.8% |
| Immigrants | St. Vincent and the Grenadines | 0.0 /100 | #288 | Tragic 13.8% |
| Guatemalans | 0.0 /100 | #289 | Tragic 13.8% |