Norwegian vs Immigrants from Ghana Married-Couple Family Poverty
COMPARE
Norwegian
Immigrants from Ghana
Married-Couple Family Poverty
Married-Couple Family Poverty Comparison
Norwegians
Immigrants from Ghana
3.7%
MARRIED-COUPLE FAMILY POVERTY
100.0/ 100
METRIC RATING
3rd/ 347
METRIC RANK
5.9%
MARRIED-COUPLE FAMILY POVERTY
1.0/ 100
METRIC RATING
251st/ 347
METRIC RANK
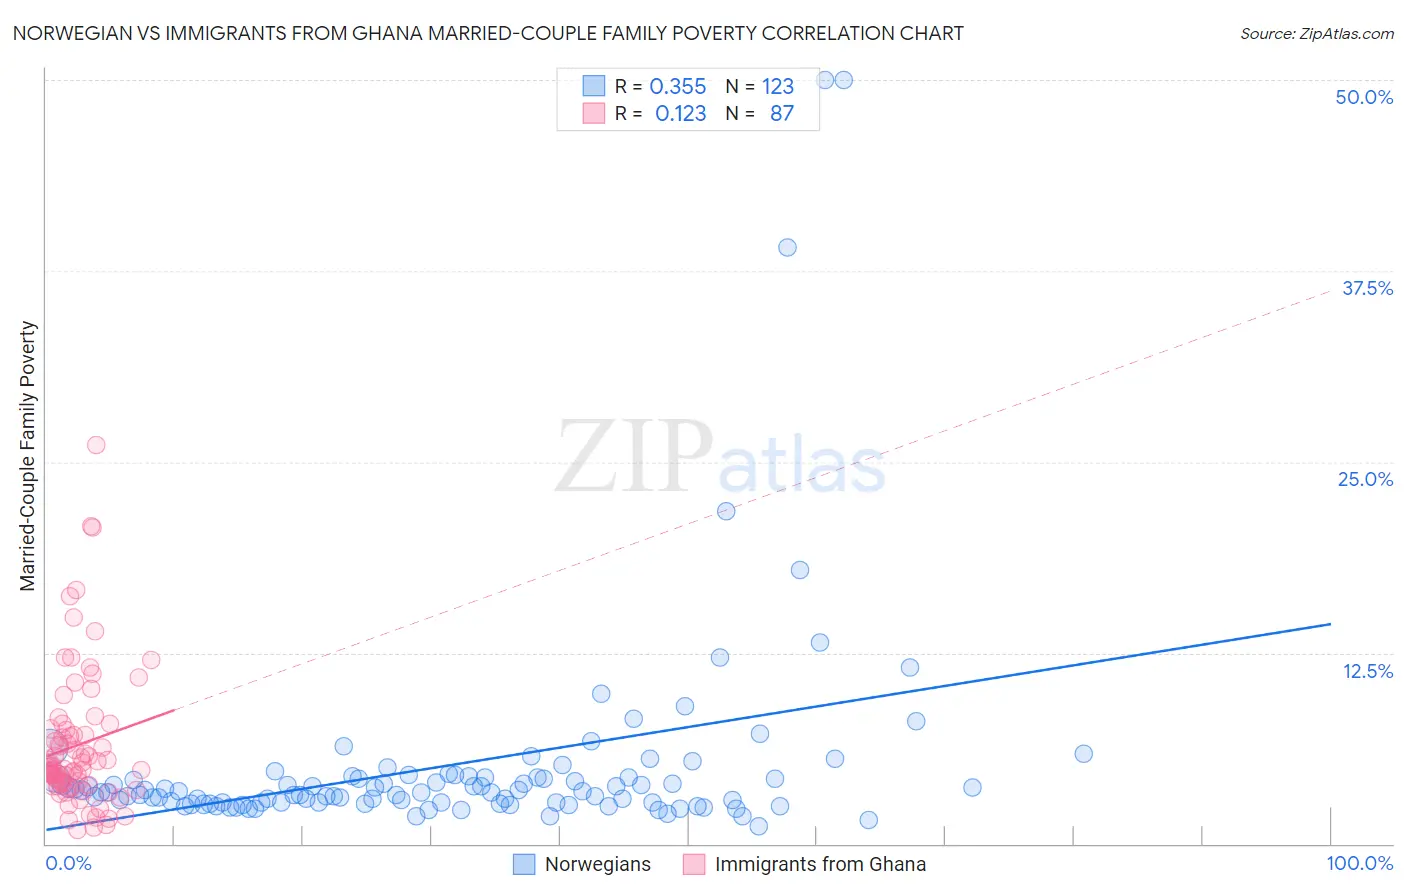
Norwegian vs Immigrants from Ghana Married-Couple Family Poverty Correlation Chart
The statistical analysis conducted on geographies consisting of 522,229,251 people shows a mild positive correlation between the proportion of Norwegians and poverty level among married-couple families in the United States with a correlation coefficient (R) of 0.355 and weighted average of 3.7%. Similarly, the statistical analysis conducted on geographies consisting of 198,995,588 people shows a poor positive correlation between the proportion of Immigrants from Ghana and poverty level among married-couple families in the United States with a correlation coefficient (R) of 0.123 and weighted average of 5.9%, a difference of 59.4%.
Married-Couple Family Poverty Correlation Summary
| Measurement | Norwegian | Immigrants from Ghana |
| Minimum | 1.2% | 0.88% |
| Maximum | 50.0% | 26.1% |
| Range | 48.8% | 25.3% |
| Mean | 5.1% | 6.4% |
| Median | 3.4% | 5.0% |
| Interquartile 25% (IQ1) | 2.7% | 3.9% |
| Interquartile 75% (IQ3) | 4.4% | 7.4% |
| Interquartile Range (IQR) | 1.7% | 3.6% |
| Standard Deviation (Sample) | 7.2% | 4.5% |
| Standard Deviation (Population) | 7.1% | 4.5% |
Similar Demographics by Married-Couple Family Poverty
Demographics Similar to Norwegians by Married-Couple Family Poverty
In terms of married-couple family poverty, the demographic groups most similar to Norwegians are Chinese (3.6%, a difference of 1.9%), Immigrants from India (3.6%, a difference of 2.1%), Slovene (3.8%, a difference of 3.6%), Swedish (3.9%, a difference of 3.8%), and Luxembourger (3.9%, a difference of 4.4%).
| Demographics | Rating | Rank | Married-Couple Family Poverty |
| Immigrants | India | 100.0 /100 | #1 | Exceptional 3.6% |
| Chinese | 100.0 /100 | #2 | Exceptional 3.6% |
| Norwegians | 100.0 /100 | #3 | Exceptional 3.7% |
| Slovenes | 100.0 /100 | #4 | Exceptional 3.8% |
| Swedes | 100.0 /100 | #5 | Exceptional 3.9% |
| Luxembourgers | 100.0 /100 | #6 | Exceptional 3.9% |
| Latvians | 100.0 /100 | #7 | Exceptional 3.9% |
| Thais | 100.0 /100 | #8 | Exceptional 3.9% |
| Croatians | 100.0 /100 | #9 | Exceptional 3.9% |
| Carpatho Rusyns | 100.0 /100 | #10 | Exceptional 3.9% |
| Lithuanians | 100.0 /100 | #11 | Exceptional 4.0% |
| Bulgarians | 100.0 /100 | #12 | Exceptional 4.0% |
| Czechs | 100.0 /100 | #13 | Exceptional 4.0% |
| Slovaks | 100.0 /100 | #14 | Exceptional 4.0% |
| Poles | 100.0 /100 | #15 | Exceptional 4.0% |
Demographics Similar to Immigrants from Ghana by Married-Couple Family Poverty
In terms of married-couple family poverty, the demographic groups most similar to Immigrants from Ghana are Immigrants from Eritrea (5.9%, a difference of 0.25%), Tsimshian (5.9%, a difference of 0.46%), Cree (5.9%, a difference of 0.57%), Immigrants from Western Asia (6.0%, a difference of 0.64%), and African (6.0%, a difference of 0.73%).
| Demographics | Rating | Rank | Married-Couple Family Poverty |
| Chickasaw | 2.3 /100 | #244 | Tragic 5.8% |
| Immigrants | Afghanistan | 2.1 /100 | #245 | Tragic 5.8% |
| Immigrants | Venezuela | 1.8 /100 | #246 | Tragic 5.8% |
| Iraqis | 1.4 /100 | #247 | Tragic 5.9% |
| Cree | 1.2 /100 | #248 | Tragic 5.9% |
| Tsimshian | 1.1 /100 | #249 | Tragic 5.9% |
| Immigrants | Eritrea | 1.1 /100 | #250 | Tragic 5.9% |
| Immigrants | Ghana | 1.0 /100 | #251 | Tragic 5.9% |
| Immigrants | Western Asia | 0.7 /100 | #252 | Tragic 6.0% |
| Africans | 0.7 /100 | #253 | Tragic 6.0% |
| Immigrants | Somalia | 0.7 /100 | #254 | Tragic 6.0% |
| Comanche | 0.7 /100 | #255 | Tragic 6.0% |
| Bangladeshis | 0.5 /100 | #256 | Tragic 6.0% |
| Immigrants | Burma/Myanmar | 0.5 /100 | #257 | Tragic 6.0% |
| Immigrants | Immigrants | 0.5 /100 | #258 | Tragic 6.0% |