Mongolian vs Immigrants from Ireland Single Female Poverty
COMPARE
Mongolian
Immigrants from Ireland
Single Female Poverty
Single Female Poverty Comparison
Mongolians
Immigrants from Ireland
20.2%
SINGLE FEMALE POVERTY
93.2/ 100
METRIC RATING
127th/ 347
METRIC RANK
17.8%
SINGLE FEMALE POVERTY
100.0/ 100
METRIC RATING
10th/ 347
METRIC RANK
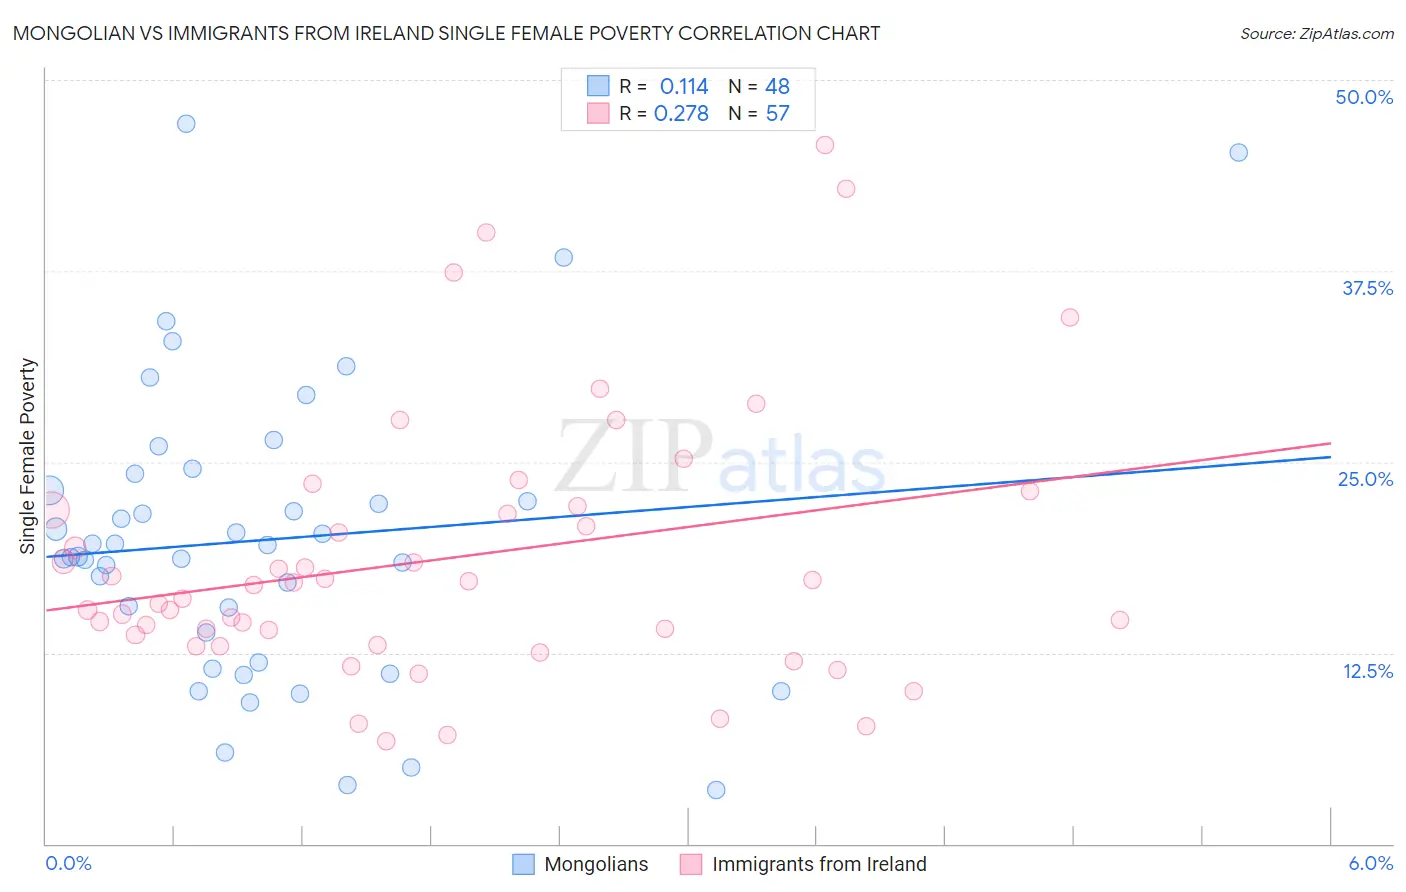
Mongolian vs Immigrants from Ireland Single Female Poverty Correlation Chart
The statistical analysis conducted on geographies consisting of 139,671,707 people shows a poor positive correlation between the proportion of Mongolians and poverty level among single females in the United States with a correlation coefficient (R) of 0.114 and weighted average of 20.2%. Similarly, the statistical analysis conducted on geographies consisting of 237,318,290 people shows a weak positive correlation between the proportion of Immigrants from Ireland and poverty level among single females in the United States with a correlation coefficient (R) of 0.278 and weighted average of 17.8%, a difference of 13.4%.
Single Female Poverty Correlation Summary
| Measurement | Mongolian | Immigrants from Ireland |
| Minimum | 3.5% | 6.7% |
| Maximum | 47.1% | 45.8% |
| Range | 43.6% | 39.1% |
| Mean | 19.9% | 18.7% |
| Median | 19.2% | 17.0% |
| Interquartile 25% (IQ1) | 12.8% | 13.4% |
| Interquartile 75% (IQ3) | 23.7% | 22.0% |
| Interquartile Range (IQR) | 10.9% | 8.6% |
| Standard Deviation (Sample) | 9.6% | 8.7% |
| Standard Deviation (Population) | 9.5% | 8.6% |
Similar Demographics by Single Female Poverty
Demographics Similar to Mongolians by Single Female Poverty
In terms of single female poverty, the demographic groups most similar to Mongolians are Serbian (20.1%, a difference of 0.020%), Immigrants from Spain (20.2%, a difference of 0.11%), Immigrants from South Africa (20.1%, a difference of 0.19%), Immigrants from Morocco (20.2%, a difference of 0.19%), and Immigrants from Hungary (20.2%, a difference of 0.21%).
| Demographics | Rating | Rank | Single Female Poverty |
| South Americans | 95.1 /100 | #120 | Exceptional 20.0% |
| Immigrants | Switzerland | 95.1 /100 | #121 | Exceptional 20.0% |
| Immigrants | South America | 95.0 /100 | #122 | Exceptional 20.0% |
| Brazilians | 94.4 /100 | #123 | Exceptional 20.1% |
| Immigrants | Chile | 94.3 /100 | #124 | Exceptional 20.1% |
| Immigrants | South Africa | 93.9 /100 | #125 | Exceptional 20.1% |
| Serbians | 93.3 /100 | #126 | Exceptional 20.1% |
| Mongolians | 93.2 /100 | #127 | Exceptional 20.2% |
| Immigrants | Spain | 92.7 /100 | #128 | Exceptional 20.2% |
| Immigrants | Morocco | 92.4 /100 | #129 | Exceptional 20.2% |
| Immigrants | Hungary | 92.3 /100 | #130 | Exceptional 20.2% |
| Pakistanis | 92.1 /100 | #131 | Exceptional 20.2% |
| Uruguayans | 92.1 /100 | #132 | Exceptional 20.2% |
| Immigrants | England | 91.9 /100 | #133 | Exceptional 20.2% |
| Immigrants | Venezuela | 91.5 /100 | #134 | Exceptional 20.2% |
Demographics Similar to Immigrants from Ireland by Single Female Poverty
In terms of single female poverty, the demographic groups most similar to Immigrants from Ireland are Immigrants from Lithuania (17.8%, a difference of 0.090%), Immigrants from South Central Asia (17.8%, a difference of 0.15%), Bhutanese (17.7%, a difference of 0.41%), Immigrants from Bolivia (17.8%, a difference of 0.41%), and Bolivian (17.9%, a difference of 0.85%).
| Demographics | Rating | Rank | Single Female Poverty |
| Immigrants | Hong Kong | 100.0 /100 | #3 | Exceptional 16.5% |
| Immigrants | India | 100.0 /100 | #4 | Exceptional 16.8% |
| Assyrians/Chaldeans/Syriacs | 100.0 /100 | #5 | Exceptional 17.0% |
| Filipinos | 100.0 /100 | #6 | Exceptional 17.0% |
| Thais | 100.0 /100 | #7 | Exceptional 17.3% |
| Immigrants | Iran | 100.0 /100 | #8 | Exceptional 17.5% |
| Bhutanese | 100.0 /100 | #9 | Exceptional 17.7% |
| Immigrants | Ireland | 100.0 /100 | #10 | Exceptional 17.8% |
| Immigrants | Lithuania | 100.0 /100 | #11 | Exceptional 17.8% |
| Immigrants | South Central Asia | 100.0 /100 | #12 | Exceptional 17.8% |
| Immigrants | Bolivia | 100.0 /100 | #13 | Exceptional 17.8% |
| Bolivians | 100.0 /100 | #14 | Exceptional 17.9% |
| Indians (Asian) | 100.0 /100 | #15 | Exceptional 17.9% |
| Iranians | 100.0 /100 | #16 | Exceptional 18.0% |
| Immigrants | Korea | 100.0 /100 | #17 | Exceptional 18.1% |