Crow vs Immigrants from Ireland Single Female Poverty
COMPARE
Crow
Immigrants from Ireland
Single Female Poverty
Single Female Poverty Comparison
Crow
Immigrants from Ireland
32.4%
SINGLE FEMALE POVERTY
0.0/ 100
METRIC RATING
343rd/ 347
METRIC RANK
17.8%
SINGLE FEMALE POVERTY
100.0/ 100
METRIC RATING
10th/ 347
METRIC RANK
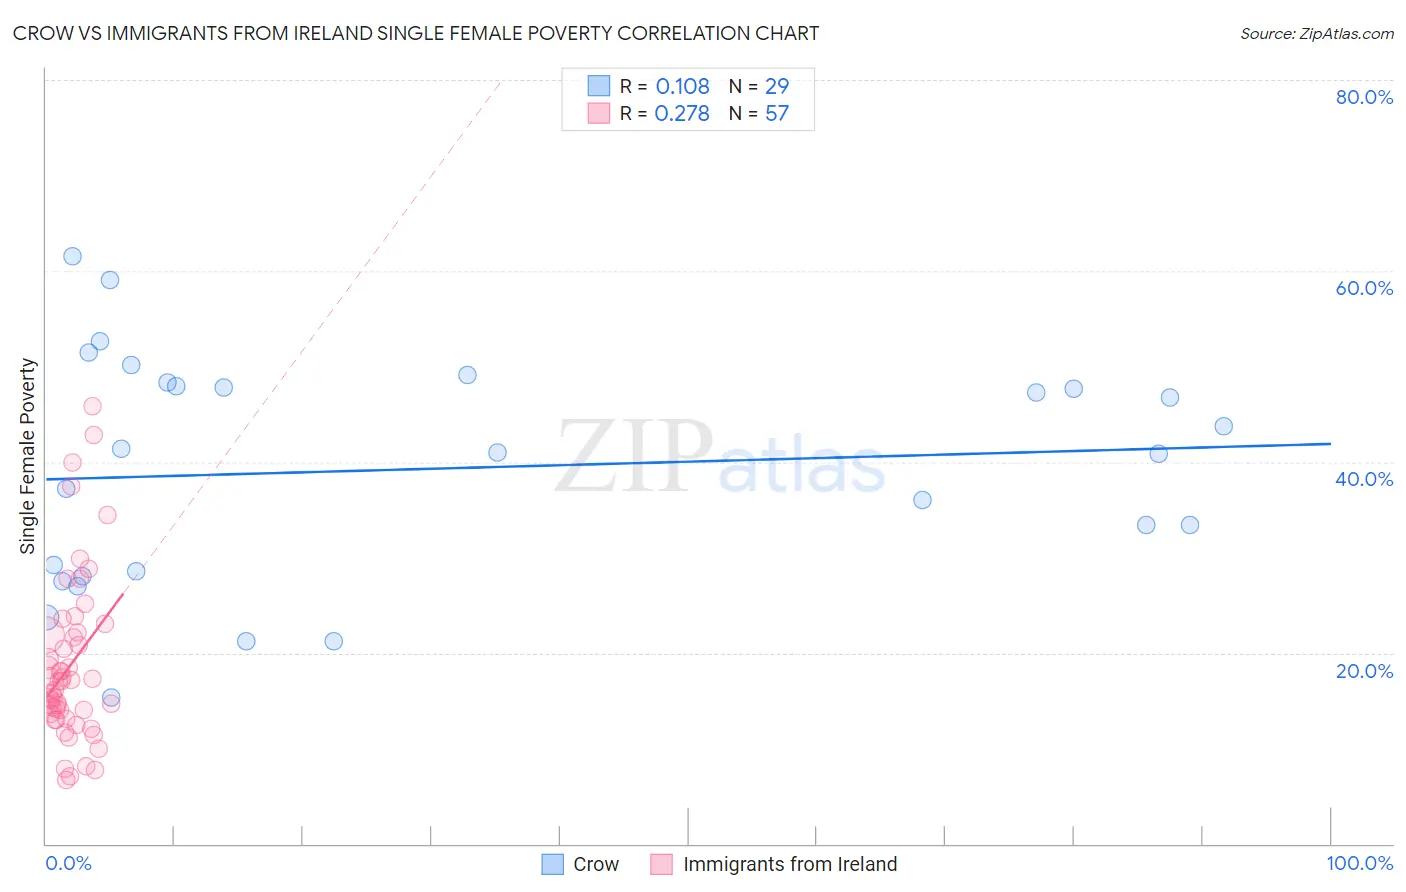
Crow vs Immigrants from Ireland Single Female Poverty Correlation Chart
The statistical analysis conducted on geographies consisting of 58,998,568 people shows a poor positive correlation between the proportion of Crow and poverty level among single females in the United States with a correlation coefficient (R) of 0.108 and weighted average of 32.4%. Similarly, the statistical analysis conducted on geographies consisting of 237,318,290 people shows a weak positive correlation between the proportion of Immigrants from Ireland and poverty level among single females in the United States with a correlation coefficient (R) of 0.278 and weighted average of 17.8%, a difference of 82.4%.
Single Female Poverty Correlation Summary
| Measurement | Crow | Immigrants from Ireland |
| Minimum | 15.4% | 6.7% |
| Maximum | 61.5% | 45.8% |
| Range | 46.1% | 39.1% |
| Mean | 39.3% | 18.7% |
| Median | 40.9% | 17.0% |
| Interquartile 25% (IQ1) | 28.3% | 13.4% |
| Interquartile 75% (IQ3) | 48.1% | 22.0% |
| Interquartile Range (IQR) | 19.8% | 8.6% |
| Standard Deviation (Sample) | 12.0% | 8.7% |
| Standard Deviation (Population) | 11.8% | 8.6% |
Similar Demographics by Single Female Poverty
Demographics Similar to Crow by Single Female Poverty
In terms of single female poverty, the demographic groups most similar to Crow are Lumbee (33.0%, a difference of 1.8%), Navajo (31.7%, a difference of 2.4%), Sioux (31.3%, a difference of 3.7%), Houma (33.8%, a difference of 4.3%), and Puerto Rican (34.1%, a difference of 5.2%).
| Demographics | Rating | Rank | Single Female Poverty |
| Ute | 0.0 /100 | #333 | Tragic 28.4% |
| Pueblo | 0.0 /100 | #334 | Tragic 28.6% |
| Immigrants | Yemen | 0.0 /100 | #335 | Tragic 28.9% |
| Colville | 0.0 /100 | #336 | Tragic 29.1% |
| Yuman | 0.0 /100 | #337 | Tragic 29.4% |
| Pima | 0.0 /100 | #338 | Tragic 30.3% |
| Cheyenne | 0.0 /100 | #339 | Tragic 30.4% |
| Cajuns | 0.0 /100 | #340 | Tragic 30.6% |
| Sioux | 0.0 /100 | #341 | Tragic 31.3% |
| Navajo | 0.0 /100 | #342 | Tragic 31.7% |
| Crow | 0.0 /100 | #343 | Tragic 32.4% |
| Lumbee | 0.0 /100 | #344 | Tragic 33.0% |
| Houma | 0.0 /100 | #345 | Tragic 33.8% |
| Puerto Ricans | 0.0 /100 | #346 | Tragic 34.1% |
| Tohono O'odham | 0.0 /100 | #347 | Tragic 34.2% |
Demographics Similar to Immigrants from Ireland by Single Female Poverty
In terms of single female poverty, the demographic groups most similar to Immigrants from Ireland are Immigrants from Lithuania (17.8%, a difference of 0.090%), Immigrants from South Central Asia (17.8%, a difference of 0.15%), Bhutanese (17.7%, a difference of 0.41%), Immigrants from Bolivia (17.8%, a difference of 0.41%), and Bolivian (17.9%, a difference of 0.85%).
| Demographics | Rating | Rank | Single Female Poverty |
| Immigrants | Hong Kong | 100.0 /100 | #3 | Exceptional 16.5% |
| Immigrants | India | 100.0 /100 | #4 | Exceptional 16.8% |
| Assyrians/Chaldeans/Syriacs | 100.0 /100 | #5 | Exceptional 17.0% |
| Filipinos | 100.0 /100 | #6 | Exceptional 17.0% |
| Thais | 100.0 /100 | #7 | Exceptional 17.3% |
| Immigrants | Iran | 100.0 /100 | #8 | Exceptional 17.5% |
| Bhutanese | 100.0 /100 | #9 | Exceptional 17.7% |
| Immigrants | Ireland | 100.0 /100 | #10 | Exceptional 17.8% |
| Immigrants | Lithuania | 100.0 /100 | #11 | Exceptional 17.8% |
| Immigrants | South Central Asia | 100.0 /100 | #12 | Exceptional 17.8% |
| Immigrants | Bolivia | 100.0 /100 | #13 | Exceptional 17.8% |
| Bolivians | 100.0 /100 | #14 | Exceptional 17.9% |
| Indians (Asian) | 100.0 /100 | #15 | Exceptional 17.9% |
| Iranians | 100.0 /100 | #16 | Exceptional 18.0% |
| Immigrants | Korea | 100.0 /100 | #17 | Exceptional 18.1% |