Mongolian vs Immigrants from Cameroon Single Female Poverty
COMPARE
Mongolian
Immigrants from Cameroon
Single Female Poverty
Single Female Poverty Comparison
Mongolians
Immigrants from Cameroon
20.2%
SINGLE FEMALE POVERTY
93.2/ 100
METRIC RATING
127th/ 347
METRIC RANK
19.8%
SINGLE FEMALE POVERTY
97.3/ 100
METRIC RATING
102nd/ 347
METRIC RANK
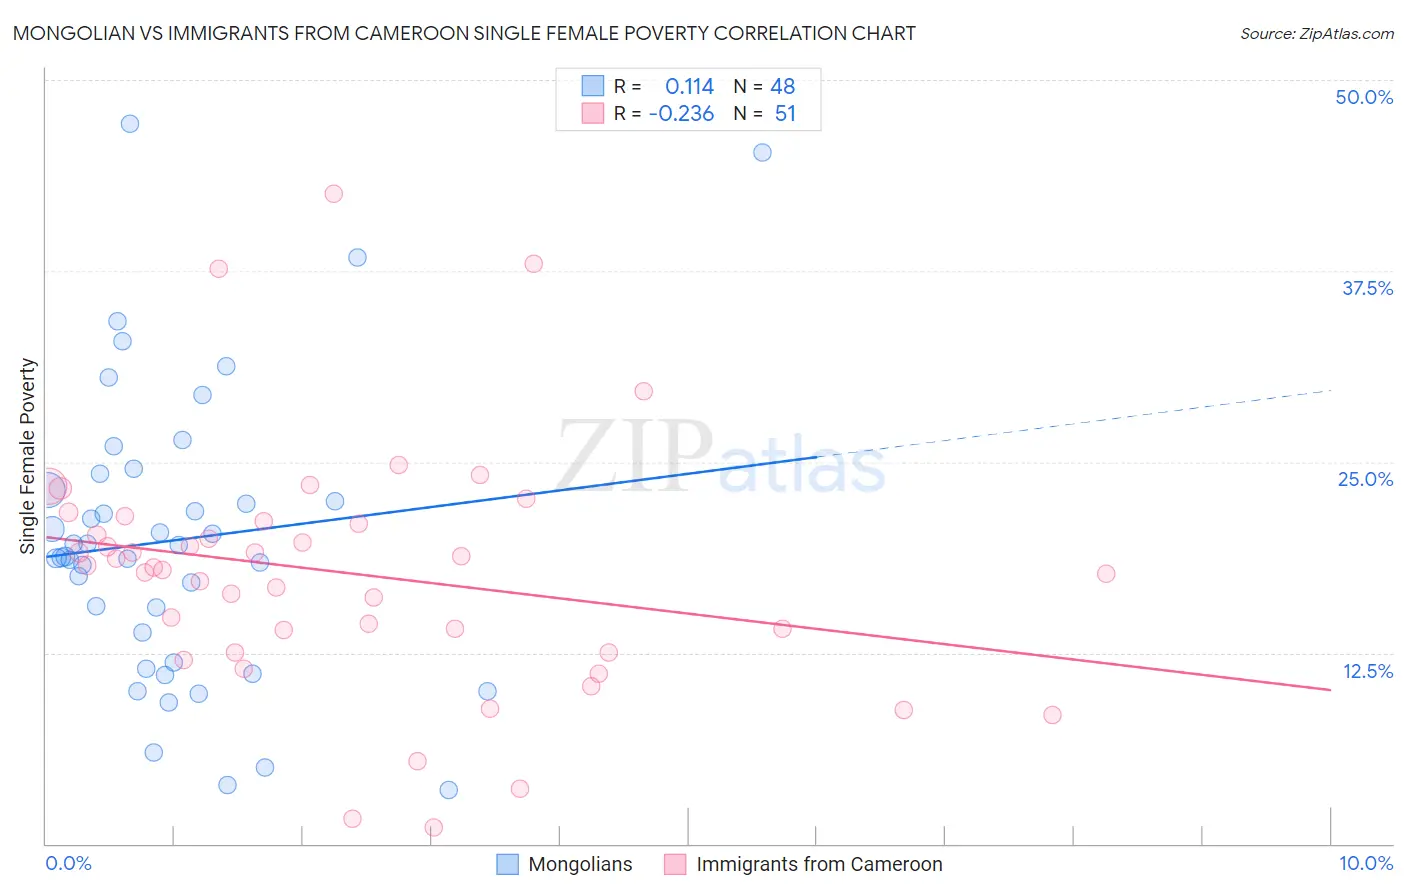
Mongolian vs Immigrants from Cameroon Single Female Poverty Correlation Chart
The statistical analysis conducted on geographies consisting of 139,671,707 people shows a poor positive correlation between the proportion of Mongolians and poverty level among single females in the United States with a correlation coefficient (R) of 0.114 and weighted average of 20.2%. Similarly, the statistical analysis conducted on geographies consisting of 130,300,683 people shows a weak negative correlation between the proportion of Immigrants from Cameroon and poverty level among single females in the United States with a correlation coefficient (R) of -0.236 and weighted average of 19.8%, a difference of 1.6%.
Single Female Poverty Correlation Summary
| Measurement | Mongolian | Immigrants from Cameroon |
| Minimum | 3.5% | 1.1% |
| Maximum | 47.1% | 42.6% |
| Range | 43.6% | 41.5% |
| Mean | 19.9% | 17.7% |
| Median | 19.2% | 18.1% |
| Interquartile 25% (IQ1) | 12.8% | 12.5% |
| Interquartile 75% (IQ3) | 23.7% | 21.1% |
| Interquartile Range (IQR) | 10.9% | 8.5% |
| Standard Deviation (Sample) | 9.6% | 8.1% |
| Standard Deviation (Population) | 9.5% | 8.0% |
Similar Demographics by Single Female Poverty
Demographics Similar to Mongolians by Single Female Poverty
In terms of single female poverty, the demographic groups most similar to Mongolians are Serbian (20.1%, a difference of 0.020%), Immigrants from Spain (20.2%, a difference of 0.11%), Immigrants from South Africa (20.1%, a difference of 0.19%), Immigrants from Morocco (20.2%, a difference of 0.19%), and Immigrants from Hungary (20.2%, a difference of 0.21%).
| Demographics | Rating | Rank | Single Female Poverty |
| South Americans | 95.1 /100 | #120 | Exceptional 20.0% |
| Immigrants | Switzerland | 95.1 /100 | #121 | Exceptional 20.0% |
| Immigrants | South America | 95.0 /100 | #122 | Exceptional 20.0% |
| Brazilians | 94.4 /100 | #123 | Exceptional 20.1% |
| Immigrants | Chile | 94.3 /100 | #124 | Exceptional 20.1% |
| Immigrants | South Africa | 93.9 /100 | #125 | Exceptional 20.1% |
| Serbians | 93.3 /100 | #126 | Exceptional 20.1% |
| Mongolians | 93.2 /100 | #127 | Exceptional 20.2% |
| Immigrants | Spain | 92.7 /100 | #128 | Exceptional 20.2% |
| Immigrants | Morocco | 92.4 /100 | #129 | Exceptional 20.2% |
| Immigrants | Hungary | 92.3 /100 | #130 | Exceptional 20.2% |
| Pakistanis | 92.1 /100 | #131 | Exceptional 20.2% |
| Uruguayans | 92.1 /100 | #132 | Exceptional 20.2% |
| Immigrants | England | 91.9 /100 | #133 | Exceptional 20.2% |
| Immigrants | Venezuela | 91.5 /100 | #134 | Exceptional 20.2% |
Demographics Similar to Immigrants from Cameroon by Single Female Poverty
In terms of single female poverty, the demographic groups most similar to Immigrants from Cameroon are Immigrants from Belgium (19.8%, a difference of 0.010%), Immigrants from Southern Europe (19.9%, a difference of 0.12%), Ukrainian (19.8%, a difference of 0.19%), Chilean (19.9%, a difference of 0.24%), and Israeli (19.9%, a difference of 0.25%).
| Demographics | Rating | Rank | Single Female Poverty |
| Estonians | 98.2 /100 | #95 | Exceptional 19.7% |
| Immigrants | Brazil | 98.2 /100 | #96 | Exceptional 19.7% |
| Croatians | 98.1 /100 | #97 | Exceptional 19.7% |
| Immigrants | France | 97.9 /100 | #98 | Exceptional 19.7% |
| Sierra Leoneans | 97.9 /100 | #99 | Exceptional 19.7% |
| Ukrainians | 97.6 /100 | #100 | Exceptional 19.8% |
| Immigrants | Belgium | 97.3 /100 | #101 | Exceptional 19.8% |
| Immigrants | Cameroon | 97.3 /100 | #102 | Exceptional 19.8% |
| Immigrants | Southern Europe | 97.1 /100 | #103 | Exceptional 19.9% |
| Chileans | 96.9 /100 | #104 | Exceptional 19.9% |
| Israelis | 96.9 /100 | #105 | Exceptional 19.9% |
| Ethiopians | 96.7 /100 | #106 | Exceptional 19.9% |
| Immigrants | Syria | 96.7 /100 | #107 | Exceptional 19.9% |
| Native Hawaiians | 96.6 /100 | #108 | Exceptional 19.9% |
| Colombians | 96.6 /100 | #109 | Exceptional 19.9% |