Mongolian vs Native/Alaskan Single Female Poverty
COMPARE
Mongolian
Native/Alaskan
Single Female Poverty
Single Female Poverty Comparison
Mongolians
Natives/Alaskans
20.2%
SINGLE FEMALE POVERTY
93.2/ 100
METRIC RATING
127th/ 347
METRIC RANK
28.2%
SINGLE FEMALE POVERTY
0.0/ 100
METRIC RATING
331st/ 347
METRIC RANK
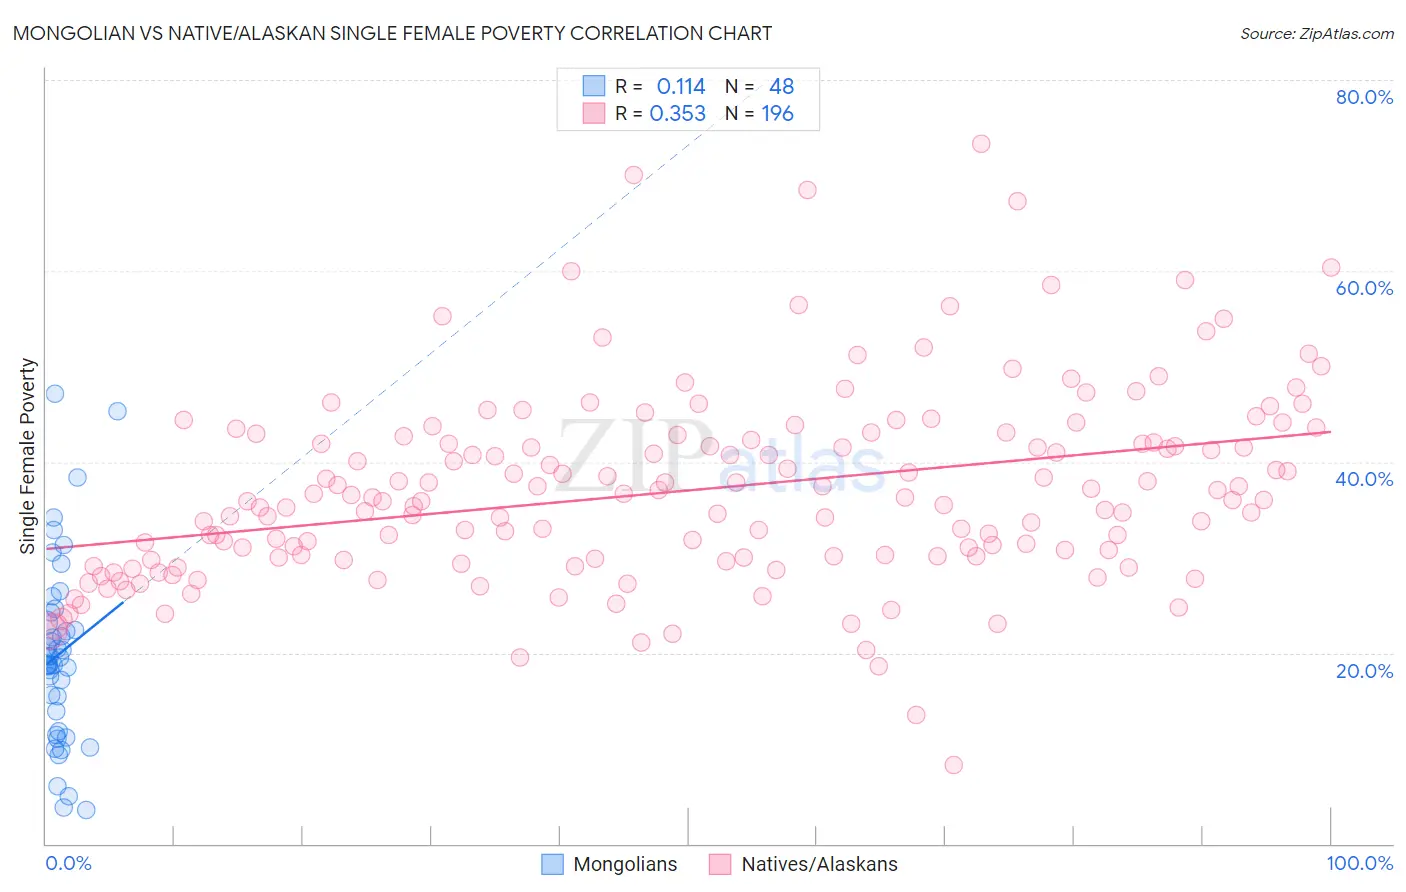
Mongolian vs Native/Alaskan Single Female Poverty Correlation Chart
The statistical analysis conducted on geographies consisting of 139,671,707 people shows a poor positive correlation between the proportion of Mongolians and poverty level among single females in the United States with a correlation coefficient (R) of 0.114 and weighted average of 20.2%. Similarly, the statistical analysis conducted on geographies consisting of 503,027,149 people shows a mild positive correlation between the proportion of Natives/Alaskans and poverty level among single females in the United States with a correlation coefficient (R) of 0.353 and weighted average of 28.2%, a difference of 40.0%.
Single Female Poverty Correlation Summary
| Measurement | Mongolian | Native/Alaskan |
| Minimum | 3.5% | 8.3% |
| Maximum | 47.1% | 73.3% |
| Range | 43.6% | 65.1% |
| Mean | 19.9% | 37.0% |
| Median | 19.2% | 36.0% |
| Interquartile 25% (IQ1) | 12.8% | 30.0% |
| Interquartile 75% (IQ3) | 23.7% | 42.5% |
| Interquartile Range (IQR) | 10.9% | 12.5% |
| Standard Deviation (Sample) | 9.6% | 10.1% |
| Standard Deviation (Population) | 9.5% | 10.1% |
Similar Demographics by Single Female Poverty
Demographics Similar to Mongolians by Single Female Poverty
In terms of single female poverty, the demographic groups most similar to Mongolians are Serbian (20.1%, a difference of 0.020%), Immigrants from Spain (20.2%, a difference of 0.11%), Immigrants from South Africa (20.1%, a difference of 0.19%), Immigrants from Morocco (20.2%, a difference of 0.19%), and Immigrants from Hungary (20.2%, a difference of 0.21%).
| Demographics | Rating | Rank | Single Female Poverty |
| South Americans | 95.1 /100 | #120 | Exceptional 20.0% |
| Immigrants | Switzerland | 95.1 /100 | #121 | Exceptional 20.0% |
| Immigrants | South America | 95.0 /100 | #122 | Exceptional 20.0% |
| Brazilians | 94.4 /100 | #123 | Exceptional 20.1% |
| Immigrants | Chile | 94.3 /100 | #124 | Exceptional 20.1% |
| Immigrants | South Africa | 93.9 /100 | #125 | Exceptional 20.1% |
| Serbians | 93.3 /100 | #126 | Exceptional 20.1% |
| Mongolians | 93.2 /100 | #127 | Exceptional 20.2% |
| Immigrants | Spain | 92.7 /100 | #128 | Exceptional 20.2% |
| Immigrants | Morocco | 92.4 /100 | #129 | Exceptional 20.2% |
| Immigrants | Hungary | 92.3 /100 | #130 | Exceptional 20.2% |
| Pakistanis | 92.1 /100 | #131 | Exceptional 20.2% |
| Uruguayans | 92.1 /100 | #132 | Exceptional 20.2% |
| Immigrants | England | 91.9 /100 | #133 | Exceptional 20.2% |
| Immigrants | Venezuela | 91.5 /100 | #134 | Exceptional 20.2% |
Demographics Similar to Natives/Alaskans by Single Female Poverty
In terms of single female poverty, the demographic groups most similar to Natives/Alaskans are Yakama (28.3%, a difference of 0.26%), Hopi (28.0%, a difference of 0.64%), Ute (28.4%, a difference of 0.68%), Menominee (27.8%, a difference of 1.3%), and Pueblo (28.6%, a difference of 1.4%).
| Demographics | Rating | Rank | Single Female Poverty |
| Kiowa | 0.0 /100 | #324 | Tragic 26.9% |
| Choctaw | 0.0 /100 | #325 | Tragic 27.2% |
| Creek | 0.0 /100 | #326 | Tragic 27.4% |
| Dutch West Indians | 0.0 /100 | #327 | Tragic 27.5% |
| Apache | 0.0 /100 | #328 | Tragic 27.7% |
| Menominee | 0.0 /100 | #329 | Tragic 27.8% |
| Hopi | 0.0 /100 | #330 | Tragic 28.0% |
| Natives/Alaskans | 0.0 /100 | #331 | Tragic 28.2% |
| Yakama | 0.0 /100 | #332 | Tragic 28.3% |
| Ute | 0.0 /100 | #333 | Tragic 28.4% |
| Pueblo | 0.0 /100 | #334 | Tragic 28.6% |
| Immigrants | Yemen | 0.0 /100 | #335 | Tragic 28.9% |
| Colville | 0.0 /100 | #336 | Tragic 29.1% |
| Yuman | 0.0 /100 | #337 | Tragic 29.4% |
| Pima | 0.0 /100 | #338 | Tragic 30.3% |