Mongolian vs Bermudan Single Female Poverty
COMPARE
Mongolian
Bermudan
Single Female Poverty
Single Female Poverty Comparison
Mongolians
Bermudans
20.2%
SINGLE FEMALE POVERTY
93.2/ 100
METRIC RATING
127th/ 347
METRIC RANK
22.3%
SINGLE FEMALE POVERTY
2.0/ 100
METRIC RATING
242nd/ 347
METRIC RANK
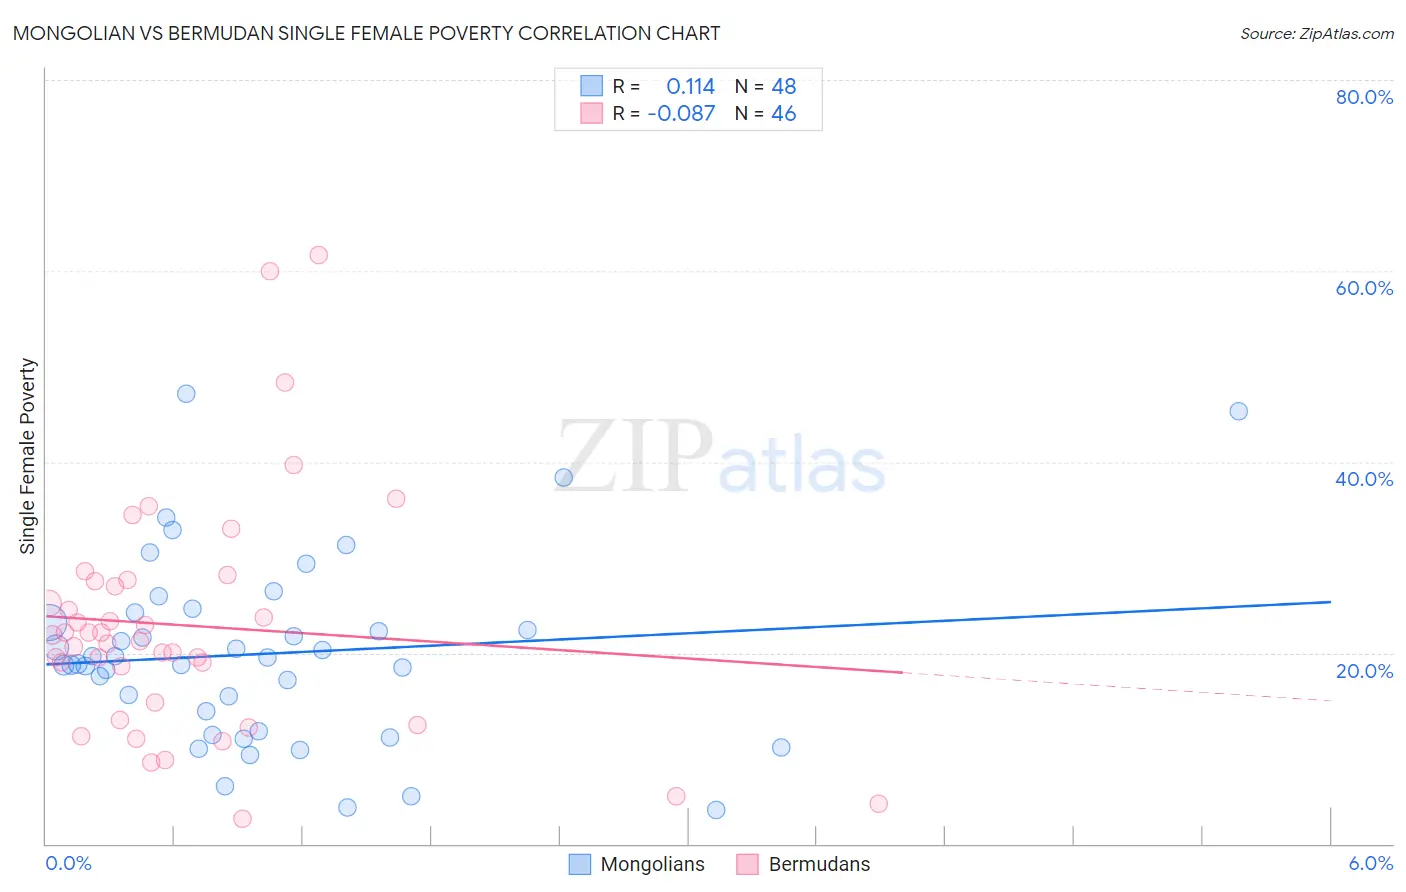
Mongolian vs Bermudan Single Female Poverty Correlation Chart
The statistical analysis conducted on geographies consisting of 139,671,707 people shows a poor positive correlation between the proportion of Mongolians and poverty level among single females in the United States with a correlation coefficient (R) of 0.114 and weighted average of 20.2%. Similarly, the statistical analysis conducted on geographies consisting of 55,621,982 people shows a slight negative correlation between the proportion of Bermudans and poverty level among single females in the United States with a correlation coefficient (R) of -0.087 and weighted average of 22.3%, a difference of 10.5%.
Single Female Poverty Correlation Summary
| Measurement | Mongolian | Bermudan |
| Minimum | 3.5% | 2.6% |
| Maximum | 47.1% | 61.7% |
| Range | 43.6% | 59.1% |
| Mean | 19.9% | 22.9% |
| Median | 19.2% | 21.5% |
| Interquartile 25% (IQ1) | 12.8% | 14.8% |
| Interquartile 75% (IQ3) | 23.7% | 27.4% |
| Interquartile Range (IQR) | 10.9% | 12.7% |
| Standard Deviation (Sample) | 9.6% | 12.4% |
| Standard Deviation (Population) | 9.5% | 12.3% |
Similar Demographics by Single Female Poverty
Demographics Similar to Mongolians by Single Female Poverty
In terms of single female poverty, the demographic groups most similar to Mongolians are Serbian (20.1%, a difference of 0.020%), Immigrants from Spain (20.2%, a difference of 0.11%), Immigrants from South Africa (20.1%, a difference of 0.19%), Immigrants from Morocco (20.2%, a difference of 0.19%), and Immigrants from Hungary (20.2%, a difference of 0.21%).
| Demographics | Rating | Rank | Single Female Poverty |
| South Americans | 95.1 /100 | #120 | Exceptional 20.0% |
| Immigrants | Switzerland | 95.1 /100 | #121 | Exceptional 20.0% |
| Immigrants | South America | 95.0 /100 | #122 | Exceptional 20.0% |
| Brazilians | 94.4 /100 | #123 | Exceptional 20.1% |
| Immigrants | Chile | 94.3 /100 | #124 | Exceptional 20.1% |
| Immigrants | South Africa | 93.9 /100 | #125 | Exceptional 20.1% |
| Serbians | 93.3 /100 | #126 | Exceptional 20.1% |
| Mongolians | 93.2 /100 | #127 | Exceptional 20.2% |
| Immigrants | Spain | 92.7 /100 | #128 | Exceptional 20.2% |
| Immigrants | Morocco | 92.4 /100 | #129 | Exceptional 20.2% |
| Immigrants | Hungary | 92.3 /100 | #130 | Exceptional 20.2% |
| Pakistanis | 92.1 /100 | #131 | Exceptional 20.2% |
| Uruguayans | 92.1 /100 | #132 | Exceptional 20.2% |
| Immigrants | England | 91.9 /100 | #133 | Exceptional 20.2% |
| Immigrants | Venezuela | 91.5 /100 | #134 | Exceptional 20.2% |
Demographics Similar to Bermudans by Single Female Poverty
In terms of single female poverty, the demographic groups most similar to Bermudans are Cape Verdean (22.3%, a difference of 0.070%), West Indian (22.3%, a difference of 0.090%), Immigrants from Middle Africa (22.3%, a difference of 0.10%), Immigrants from Bangladesh (22.3%, a difference of 0.14%), and French (22.2%, a difference of 0.21%).
| Demographics | Rating | Rank | Single Female Poverty |
| Dutch | 4.6 /100 | #235 | Tragic 22.0% |
| Immigrants | Ecuador | 4.2 /100 | #236 | Tragic 22.0% |
| Vietnamese | 4.0 /100 | #237 | Tragic 22.0% |
| French Canadians | 2.8 /100 | #238 | Tragic 22.2% |
| Malaysians | 2.8 /100 | #239 | Tragic 22.2% |
| French | 2.3 /100 | #240 | Tragic 22.2% |
| Cape Verdeans | 2.1 /100 | #241 | Tragic 22.3% |
| Bermudans | 2.0 /100 | #242 | Tragic 22.3% |
| West Indians | 1.9 /100 | #243 | Tragic 22.3% |
| Immigrants | Middle Africa | 1.9 /100 | #244 | Tragic 22.3% |
| Immigrants | Bangladesh | 1.8 /100 | #245 | Tragic 22.3% |
| Liberians | 1.4 /100 | #246 | Tragic 22.4% |
| Immigrants | El Salvador | 1.4 /100 | #247 | Tragic 22.4% |
| Belizeans | 1.4 /100 | #248 | Tragic 22.4% |
| Immigrants | Caribbean | 1.3 /100 | #249 | Tragic 22.4% |