Maltese vs Lebanese Single Female Poverty
COMPARE
Maltese
Lebanese
Single Female Poverty
Single Female Poverty Comparison
Maltese
Lebanese
18.3%
SINGLE FEMALE POVERTY
100.0/ 100
METRIC RATING
21st/ 347
METRIC RANK
20.8%
SINGLE FEMALE POVERTY
67.6/ 100
METRIC RATING
163rd/ 347
METRIC RANK
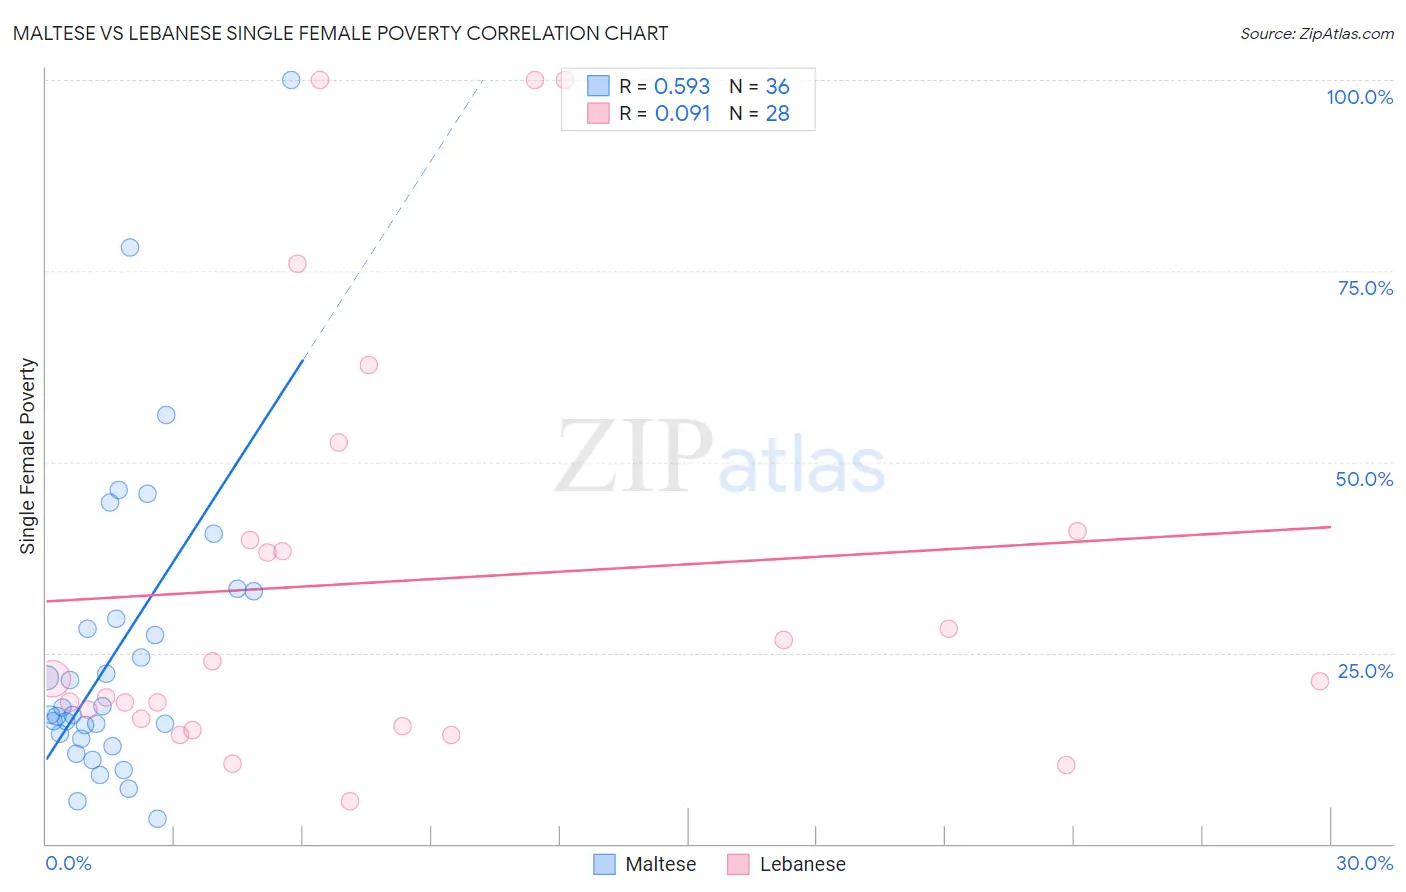
Maltese vs Lebanese Single Female Poverty Correlation Chart
The statistical analysis conducted on geographies consisting of 125,419,200 people shows a substantial positive correlation between the proportion of Maltese and poverty level among single females in the United States with a correlation coefficient (R) of 0.593 and weighted average of 18.3%. Similarly, the statistical analysis conducted on geographies consisting of 394,403,389 people shows a slight positive correlation between the proportion of Lebanese and poverty level among single females in the United States with a correlation coefficient (R) of 0.091 and weighted average of 20.8%, a difference of 13.6%.
Single Female Poverty Correlation Summary
| Measurement | Maltese | Lebanese |
| Minimum | 3.3% | 5.5% |
| Maximum | 100.0% | 100.0% |
| Range | 96.7% | 94.5% |
| Mean | 25.4% | 34.4% |
| Median | 17.4% | 21.5% |
| Interquartile 25% (IQ1) | 14.1% | 15.8% |
| Interquartile 75% (IQ3) | 31.2% | 40.4% |
| Interquartile Range (IQR) | 17.1% | 24.6% |
| Standard Deviation (Sample) | 20.2% | 28.2% |
| Standard Deviation (Population) | 19.9% | 27.7% |
Similar Demographics by Single Female Poverty
Demographics Similar to Maltese by Single Female Poverty
In terms of single female poverty, the demographic groups most similar to Maltese are Burmese (18.3%, a difference of 0.010%), Asian (18.3%, a difference of 0.020%), Immigrants from Greece (18.3%, a difference of 0.060%), Armenian (18.3%, a difference of 0.24%), and Immigrants from Singapore (18.3%, a difference of 0.34%).
| Demographics | Rating | Rank | Single Female Poverty |
| Bolivians | 100.0 /100 | #14 | Exceptional 17.9% |
| Indians (Asian) | 100.0 /100 | #15 | Exceptional 17.9% |
| Iranians | 100.0 /100 | #16 | Exceptional 18.0% |
| Immigrants | Korea | 100.0 /100 | #17 | Exceptional 18.1% |
| Immigrants | Eastern Asia | 100.0 /100 | #18 | Exceptional 18.1% |
| Immigrants | China | 100.0 /100 | #19 | Exceptional 18.1% |
| Immigrants | Greece | 100.0 /100 | #20 | Exceptional 18.3% |
| Maltese | 100.0 /100 | #21 | Exceptional 18.3% |
| Burmese | 100.0 /100 | #22 | Exceptional 18.3% |
| Asians | 100.0 /100 | #23 | Exceptional 18.3% |
| Armenians | 100.0 /100 | #24 | Exceptional 18.3% |
| Immigrants | Singapore | 100.0 /100 | #25 | Exceptional 18.3% |
| Immigrants | Israel | 100.0 /100 | #26 | Exceptional 18.3% |
| Immigrants | Pakistan | 100.0 /100 | #27 | Exceptional 18.4% |
| Immigrants | Moldova | 100.0 /100 | #28 | Exceptional 18.5% |
Demographics Similar to Lebanese by Single Female Poverty
In terms of single female poverty, the demographic groups most similar to Lebanese are Northern European (20.8%, a difference of 0.050%), Kenyan (20.8%, a difference of 0.060%), Iraqi (20.8%, a difference of 0.22%), Arab (20.7%, a difference of 0.24%), and Ugandan (20.8%, a difference of 0.26%).
| Demographics | Rating | Rank | Single Female Poverty |
| South American Indians | 75.7 /100 | #156 | Good 20.6% |
| Immigrants | Oceania | 74.3 /100 | #157 | Good 20.7% |
| Danes | 73.0 /100 | #158 | Good 20.7% |
| Costa Ricans | 71.8 /100 | #159 | Good 20.7% |
| Arabs | 70.8 /100 | #160 | Good 20.7% |
| Kenyans | 68.5 /100 | #161 | Good 20.8% |
| Northern Europeans | 68.4 /100 | #162 | Good 20.8% |
| Lebanese | 67.6 /100 | #163 | Good 20.8% |
| Iraqis | 64.5 /100 | #164 | Good 20.8% |
| Ugandans | 64.0 /100 | #165 | Good 20.8% |
| Norwegians | 63.0 /100 | #166 | Good 20.8% |
| Immigrants | Norway | 63.0 /100 | #167 | Good 20.8% |
| Immigrants | Costa Rica | 61.5 /100 | #168 | Good 20.9% |
| Immigrants | Trinidad and Tobago | 56.3 /100 | #169 | Average 20.9% |
| New Zealanders | 53.2 /100 | #170 | Average 21.0% |