Maltese vs Honduran Single Female Poverty
COMPARE
Maltese
Honduran
Single Female Poverty
Single Female Poverty Comparison
Maltese
Hondurans
18.3%
SINGLE FEMALE POVERTY
100.0/ 100
METRIC RATING
21st/ 347
METRIC RANK
25.1%
SINGLE FEMALE POVERTY
0.0/ 100
METRIC RATING
301st/ 347
METRIC RANK
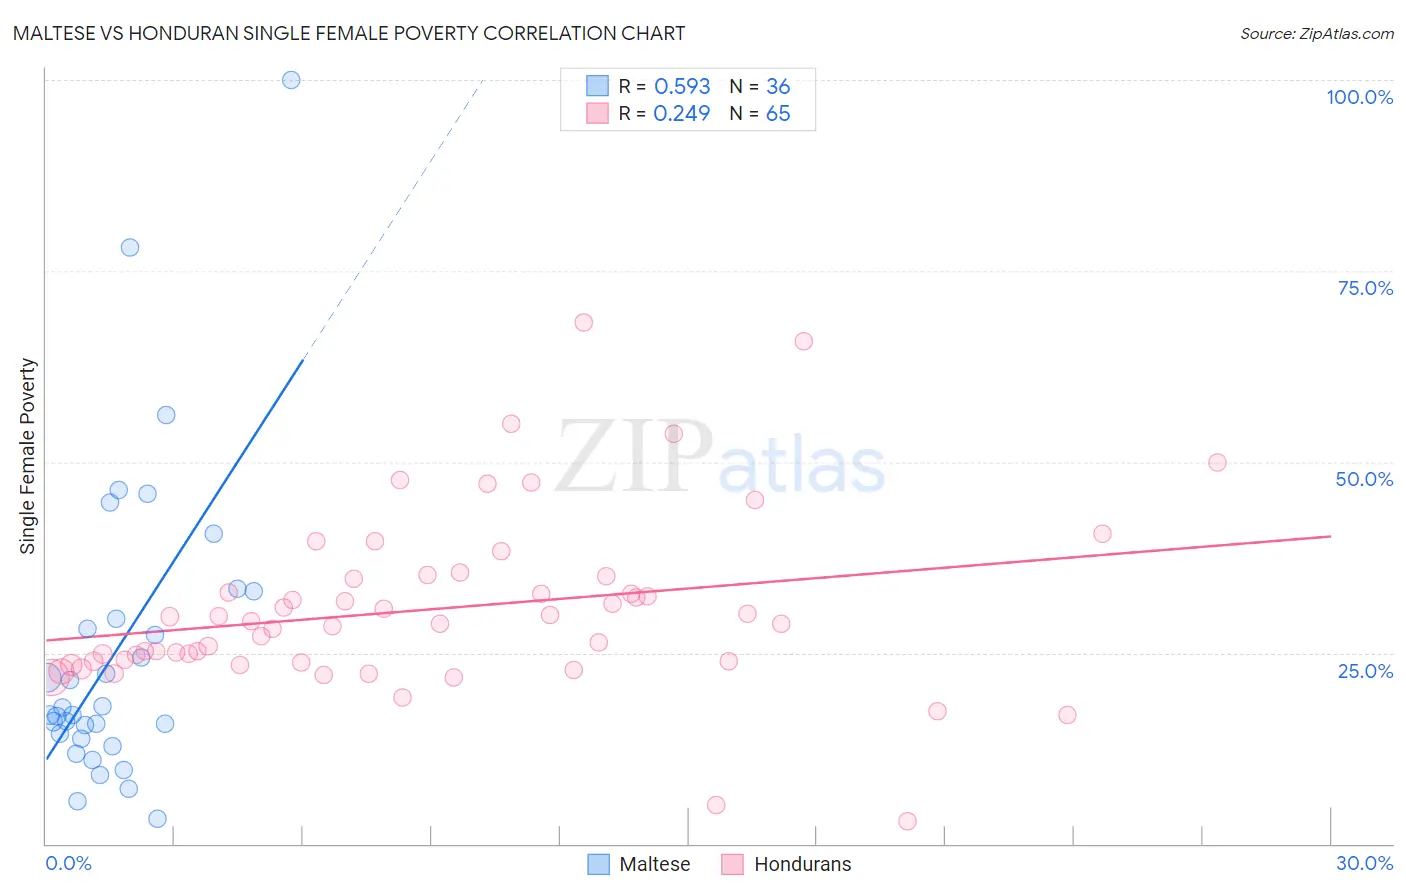
Maltese vs Honduran Single Female Poverty Correlation Chart
The statistical analysis conducted on geographies consisting of 125,419,200 people shows a substantial positive correlation between the proportion of Maltese and poverty level among single females in the United States with a correlation coefficient (R) of 0.593 and weighted average of 18.3%. Similarly, the statistical analysis conducted on geographies consisting of 354,754,258 people shows a weak positive correlation between the proportion of Hondurans and poverty level among single females in the United States with a correlation coefficient (R) of 0.249 and weighted average of 25.1%, a difference of 37.3%.
Single Female Poverty Correlation Summary
| Measurement | Maltese | Honduran |
| Minimum | 3.3% | 3.0% |
| Maximum | 100.0% | 68.3% |
| Range | 96.7% | 65.3% |
| Mean | 25.4% | 30.7% |
| Median | 17.4% | 28.8% |
| Interquartile 25% (IQ1) | 14.1% | 23.8% |
| Interquartile 75% (IQ3) | 31.2% | 34.8% |
| Interquartile Range (IQR) | 17.1% | 11.0% |
| Standard Deviation (Sample) | 20.2% | 11.6% |
| Standard Deviation (Population) | 19.9% | 11.6% |
Similar Demographics by Single Female Poverty
Demographics Similar to Maltese by Single Female Poverty
In terms of single female poverty, the demographic groups most similar to Maltese are Burmese (18.3%, a difference of 0.010%), Asian (18.3%, a difference of 0.020%), Immigrants from Greece (18.3%, a difference of 0.060%), Armenian (18.3%, a difference of 0.24%), and Immigrants from Singapore (18.3%, a difference of 0.34%).
| Demographics | Rating | Rank | Single Female Poverty |
| Bolivians | 100.0 /100 | #14 | Exceptional 17.9% |
| Indians (Asian) | 100.0 /100 | #15 | Exceptional 17.9% |
| Iranians | 100.0 /100 | #16 | Exceptional 18.0% |
| Immigrants | Korea | 100.0 /100 | #17 | Exceptional 18.1% |
| Immigrants | Eastern Asia | 100.0 /100 | #18 | Exceptional 18.1% |
| Immigrants | China | 100.0 /100 | #19 | Exceptional 18.1% |
| Immigrants | Greece | 100.0 /100 | #20 | Exceptional 18.3% |
| Maltese | 100.0 /100 | #21 | Exceptional 18.3% |
| Burmese | 100.0 /100 | #22 | Exceptional 18.3% |
| Asians | 100.0 /100 | #23 | Exceptional 18.3% |
| Armenians | 100.0 /100 | #24 | Exceptional 18.3% |
| Immigrants | Singapore | 100.0 /100 | #25 | Exceptional 18.3% |
| Immigrants | Israel | 100.0 /100 | #26 | Exceptional 18.3% |
| Immigrants | Pakistan | 100.0 /100 | #27 | Exceptional 18.4% |
| Immigrants | Moldova | 100.0 /100 | #28 | Exceptional 18.5% |
Demographics Similar to Hondurans by Single Female Poverty
In terms of single female poverty, the demographic groups most similar to Hondurans are Shoshone (25.1%, a difference of 0.090%), Blackfeet (25.1%, a difference of 0.18%), Mexican (25.0%, a difference of 0.25%), Somali (25.2%, a difference of 0.48%), and Immigrants from Congo (25.3%, a difference of 0.75%).
| Demographics | Rating | Rank | Single Female Poverty |
| French American Indians | 0.0 /100 | #294 | Tragic 24.6% |
| Hispanics or Latinos | 0.0 /100 | #295 | Tragic 24.6% |
| Africans | 0.0 /100 | #296 | Tragic 24.8% |
| Immigrants | Central America | 0.0 /100 | #297 | Tragic 24.8% |
| Yaqui | 0.0 /100 | #298 | Tragic 24.9% |
| Mexicans | 0.0 /100 | #299 | Tragic 25.0% |
| Blackfeet | 0.0 /100 | #300 | Tragic 25.1% |
| Hondurans | 0.0 /100 | #301 | Tragic 25.1% |
| Shoshone | 0.0 /100 | #302 | Tragic 25.1% |
| Somalis | 0.0 /100 | #303 | Tragic 25.2% |
| Immigrants | Congo | 0.0 /100 | #304 | Tragic 25.3% |
| Immigrants | Dominican Republic | 0.0 /100 | #305 | Tragic 25.3% |
| Immigrants | Mexico | 0.0 /100 | #306 | Tragic 25.3% |
| Potawatomi | 0.0 /100 | #307 | Tragic 25.4% |
| Aleuts | 0.0 /100 | #308 | Tragic 25.4% |