Maltese vs Immigrants from Dominica Single Female Poverty
COMPARE
Maltese
Immigrants from Dominica
Single Female Poverty
Single Female Poverty Comparison
Maltese
Immigrants from Dominica
18.3%
SINGLE FEMALE POVERTY
100.0/ 100
METRIC RATING
21st/ 347
METRIC RANK
23.9%
SINGLE FEMALE POVERTY
0.0/ 100
METRIC RATING
284th/ 347
METRIC RANK
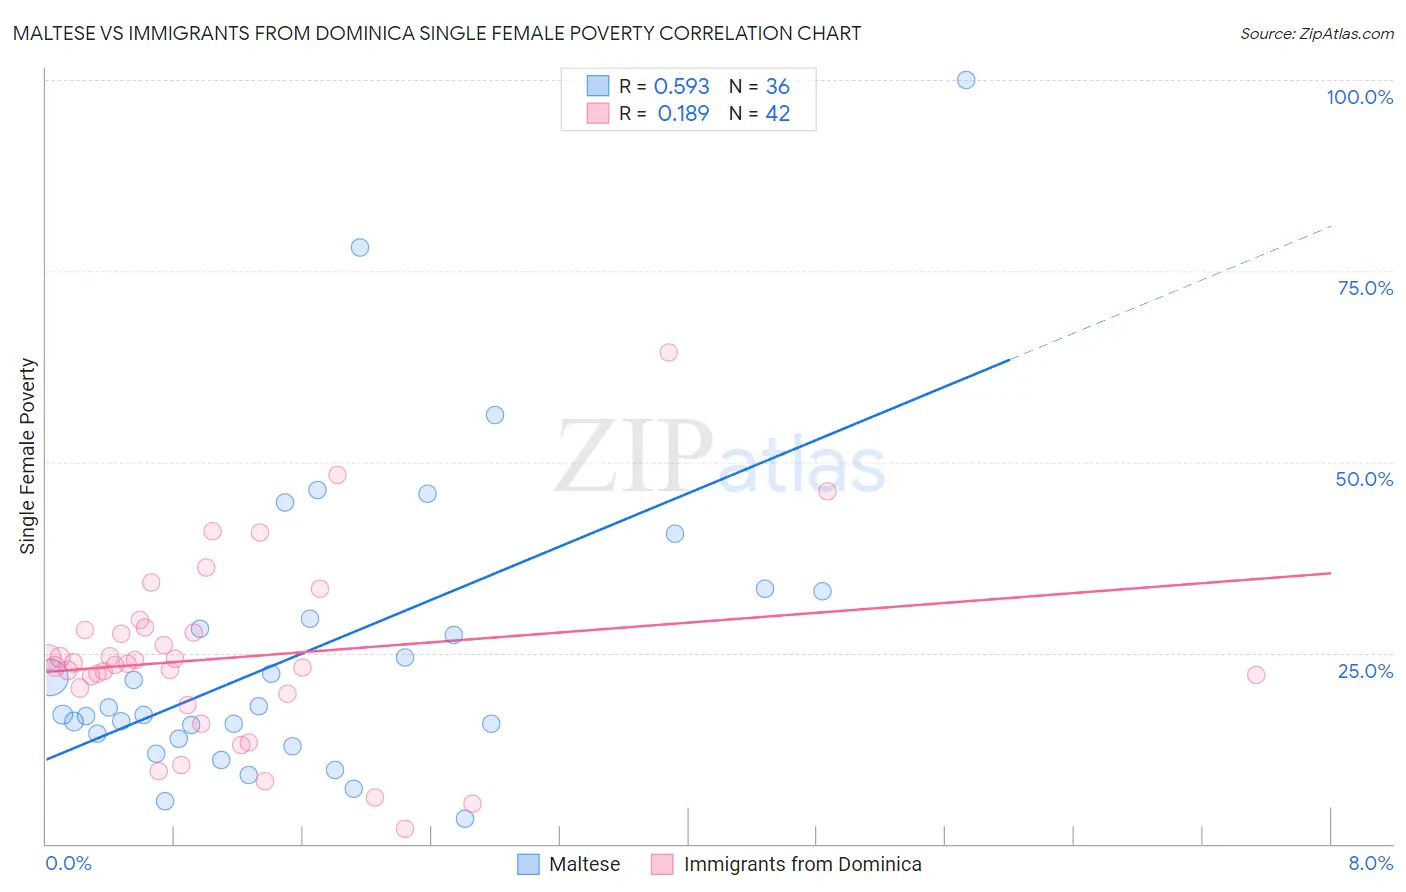
Maltese vs Immigrants from Dominica Single Female Poverty Correlation Chart
The statistical analysis conducted on geographies consisting of 125,419,200 people shows a substantial positive correlation between the proportion of Maltese and poverty level among single females in the United States with a correlation coefficient (R) of 0.593 and weighted average of 18.3%. Similarly, the statistical analysis conducted on geographies consisting of 83,649,694 people shows a poor positive correlation between the proportion of Immigrants from Dominica and poverty level among single females in the United States with a correlation coefficient (R) of 0.189 and weighted average of 23.9%, a difference of 30.8%.
Single Female Poverty Correlation Summary
| Measurement | Maltese | Immigrants from Dominica |
| Minimum | 3.3% | 2.0% |
| Maximum | 100.0% | 64.4% |
| Range | 96.7% | 62.4% |
| Mean | 25.4% | 24.4% |
| Median | 17.4% | 23.5% |
| Interquartile 25% (IQ1) | 14.1% | 19.7% |
| Interquartile 75% (IQ3) | 31.2% | 28.1% |
| Interquartile Range (IQR) | 17.1% | 8.4% |
| Standard Deviation (Sample) | 20.2% | 12.0% |
| Standard Deviation (Population) | 19.9% | 11.9% |
Similar Demographics by Single Female Poverty
Demographics Similar to Maltese by Single Female Poverty
In terms of single female poverty, the demographic groups most similar to Maltese are Burmese (18.3%, a difference of 0.010%), Asian (18.3%, a difference of 0.020%), Immigrants from Greece (18.3%, a difference of 0.060%), Armenian (18.3%, a difference of 0.24%), and Immigrants from Singapore (18.3%, a difference of 0.34%).
| Demographics | Rating | Rank | Single Female Poverty |
| Bolivians | 100.0 /100 | #14 | Exceptional 17.9% |
| Indians (Asian) | 100.0 /100 | #15 | Exceptional 17.9% |
| Iranians | 100.0 /100 | #16 | Exceptional 18.0% |
| Immigrants | Korea | 100.0 /100 | #17 | Exceptional 18.1% |
| Immigrants | Eastern Asia | 100.0 /100 | #18 | Exceptional 18.1% |
| Immigrants | China | 100.0 /100 | #19 | Exceptional 18.1% |
| Immigrants | Greece | 100.0 /100 | #20 | Exceptional 18.3% |
| Maltese | 100.0 /100 | #21 | Exceptional 18.3% |
| Burmese | 100.0 /100 | #22 | Exceptional 18.3% |
| Asians | 100.0 /100 | #23 | Exceptional 18.3% |
| Armenians | 100.0 /100 | #24 | Exceptional 18.3% |
| Immigrants | Singapore | 100.0 /100 | #25 | Exceptional 18.3% |
| Immigrants | Israel | 100.0 /100 | #26 | Exceptional 18.3% |
| Immigrants | Pakistan | 100.0 /100 | #27 | Exceptional 18.4% |
| Immigrants | Moldova | 100.0 /100 | #28 | Exceptional 18.5% |
Demographics Similar to Immigrants from Dominica by Single Female Poverty
In terms of single female poverty, the demographic groups most similar to Immigrants from Dominica are German Russian (23.9%, a difference of 0.11%), Guatemalan (23.8%, a difference of 0.25%), Immigrants from Zaire (23.8%, a difference of 0.31%), Immigrants from Latin America (23.7%, a difference of 0.82%), and Immigrants from Guatemala (24.1%, a difference of 0.86%).
| Demographics | Rating | Rank | Single Female Poverty |
| Pennsylvania Germans | 0.0 /100 | #277 | Tragic 23.6% |
| Immigrants | Nonimmigrants | 0.0 /100 | #278 | Tragic 23.6% |
| Alaskan Athabascans | 0.0 /100 | #279 | Tragic 23.6% |
| Immigrants | Latin America | 0.0 /100 | #280 | Tragic 23.7% |
| Immigrants | Zaire | 0.0 /100 | #281 | Tragic 23.8% |
| Guatemalans | 0.0 /100 | #282 | Tragic 23.8% |
| German Russians | 0.0 /100 | #283 | Tragic 23.9% |
| Immigrants | Dominica | 0.0 /100 | #284 | Tragic 23.9% |
| Immigrants | Guatemala | 0.0 /100 | #285 | Tragic 24.1% |
| Cree | 0.0 /100 | #286 | Tragic 24.1% |
| Bangladeshis | 0.0 /100 | #287 | Tragic 24.2% |
| Spanish Americans | 0.0 /100 | #288 | Tragic 24.2% |
| U.S. Virgin Islanders | 0.0 /100 | #289 | Tragic 24.2% |
| Indonesians | 0.0 /100 | #290 | Tragic 24.3% |
| Osage | 0.0 /100 | #291 | Tragic 24.4% |