Maltese vs Immigrants from Bosnia and Herzegovina Single Female Poverty
COMPARE
Maltese
Immigrants from Bosnia and Herzegovina
Single Female Poverty
Single Female Poverty Comparison
Maltese
Immigrants from Bosnia and Herzegovina
18.3%
SINGLE FEMALE POVERTY
100.0/ 100
METRIC RATING
21st/ 347
METRIC RANK
21.1%
SINGLE FEMALE POVERTY
44.9/ 100
METRIC RATING
178th/ 347
METRIC RANK
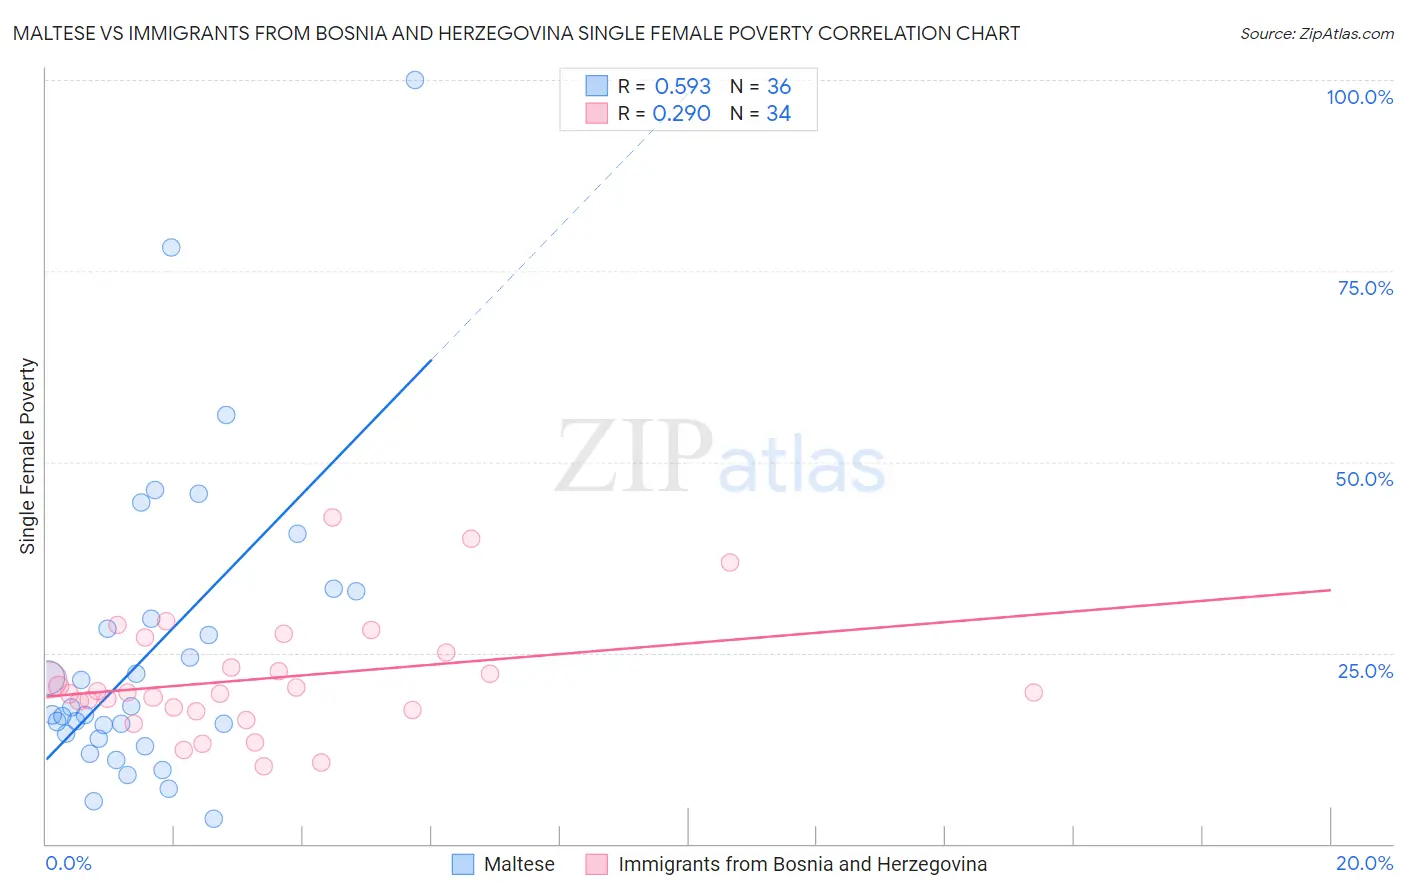
Maltese vs Immigrants from Bosnia and Herzegovina Single Female Poverty Correlation Chart
The statistical analysis conducted on geographies consisting of 125,419,200 people shows a substantial positive correlation between the proportion of Maltese and poverty level among single females in the United States with a correlation coefficient (R) of 0.593 and weighted average of 18.3%. Similarly, the statistical analysis conducted on geographies consisting of 155,809,580 people shows a weak positive correlation between the proportion of Immigrants from Bosnia and Herzegovina and poverty level among single females in the United States with a correlation coefficient (R) of 0.290 and weighted average of 21.1%, a difference of 15.3%.
Single Female Poverty Correlation Summary
| Measurement | Maltese | Immigrants from Bosnia and Herzegovina |
| Minimum | 3.3% | 10.2% |
| Maximum | 100.0% | 42.7% |
| Range | 96.7% | 32.5% |
| Mean | 25.4% | 21.6% |
| Median | 17.4% | 19.8% |
| Interquartile 25% (IQ1) | 14.1% | 17.5% |
| Interquartile 75% (IQ3) | 31.2% | 25.0% |
| Interquartile Range (IQR) | 17.1% | 7.5% |
| Standard Deviation (Sample) | 20.2% | 7.5% |
| Standard Deviation (Population) | 19.9% | 7.4% |
Similar Demographics by Single Female Poverty
Demographics Similar to Maltese by Single Female Poverty
In terms of single female poverty, the demographic groups most similar to Maltese are Burmese (18.3%, a difference of 0.010%), Asian (18.3%, a difference of 0.020%), Immigrants from Greece (18.3%, a difference of 0.060%), Armenian (18.3%, a difference of 0.24%), and Immigrants from Singapore (18.3%, a difference of 0.34%).
| Demographics | Rating | Rank | Single Female Poverty |
| Bolivians | 100.0 /100 | #14 | Exceptional 17.9% |
| Indians (Asian) | 100.0 /100 | #15 | Exceptional 17.9% |
| Iranians | 100.0 /100 | #16 | Exceptional 18.0% |
| Immigrants | Korea | 100.0 /100 | #17 | Exceptional 18.1% |
| Immigrants | Eastern Asia | 100.0 /100 | #18 | Exceptional 18.1% |
| Immigrants | China | 100.0 /100 | #19 | Exceptional 18.1% |
| Immigrants | Greece | 100.0 /100 | #20 | Exceptional 18.3% |
| Maltese | 100.0 /100 | #21 | Exceptional 18.3% |
| Burmese | 100.0 /100 | #22 | Exceptional 18.3% |
| Asians | 100.0 /100 | #23 | Exceptional 18.3% |
| Armenians | 100.0 /100 | #24 | Exceptional 18.3% |
| Immigrants | Singapore | 100.0 /100 | #25 | Exceptional 18.3% |
| Immigrants | Israel | 100.0 /100 | #26 | Exceptional 18.3% |
| Immigrants | Pakistan | 100.0 /100 | #27 | Exceptional 18.4% |
| Immigrants | Moldova | 100.0 /100 | #28 | Exceptional 18.5% |
Demographics Similar to Immigrants from Bosnia and Herzegovina by Single Female Poverty
In terms of single female poverty, the demographic groups most similar to Immigrants from Bosnia and Herzegovina are Scandinavian (21.1%, a difference of 0.020%), Canadian (21.1%, a difference of 0.040%), Czech (21.0%, a difference of 0.12%), British (21.1%, a difference of 0.12%), and Spanish American Indian (21.1%, a difference of 0.15%).
| Demographics | Rating | Rank | Single Female Poverty |
| Moroccans | 52.8 /100 | #171 | Average 21.0% |
| Guyanese | 52.0 /100 | #172 | Average 21.0% |
| Immigrants | Guyana | 50.6 /100 | #173 | Average 21.0% |
| Cubans | 50.0 /100 | #174 | Average 21.0% |
| Czechs | 46.8 /100 | #175 | Average 21.0% |
| Canadians | 45.4 /100 | #176 | Average 21.1% |
| Scandinavians | 45.2 /100 | #177 | Average 21.1% |
| Immigrants | Bosnia and Herzegovina | 44.9 /100 | #178 | Average 21.1% |
| British | 42.9 /100 | #179 | Average 21.1% |
| Spanish American Indians | 42.5 /100 | #180 | Average 21.1% |
| Europeans | 42.3 /100 | #181 | Average 21.1% |
| Slavs | 40.5 /100 | #182 | Average 21.1% |
| Slovaks | 39.7 /100 | #183 | Fair 21.1% |
| Hungarians | 39.6 /100 | #184 | Fair 21.1% |
| Immigrants | Cambodia | 38.2 /100 | #185 | Fair 21.2% |