Luxembourger vs Immigrants from Mexico Single Male Poverty
COMPARE
Luxembourger
Immigrants from Mexico
Single Male Poverty
Single Male Poverty Comparison
Luxembourgers
Immigrants from Mexico
13.4%
SINGLE MALE POVERTY
3.6/ 100
METRIC RATING
236th/ 347
METRIC RANK
13.9%
SINGLE MALE POVERTY
0.1/ 100
METRIC RATING
268th/ 347
METRIC RANK
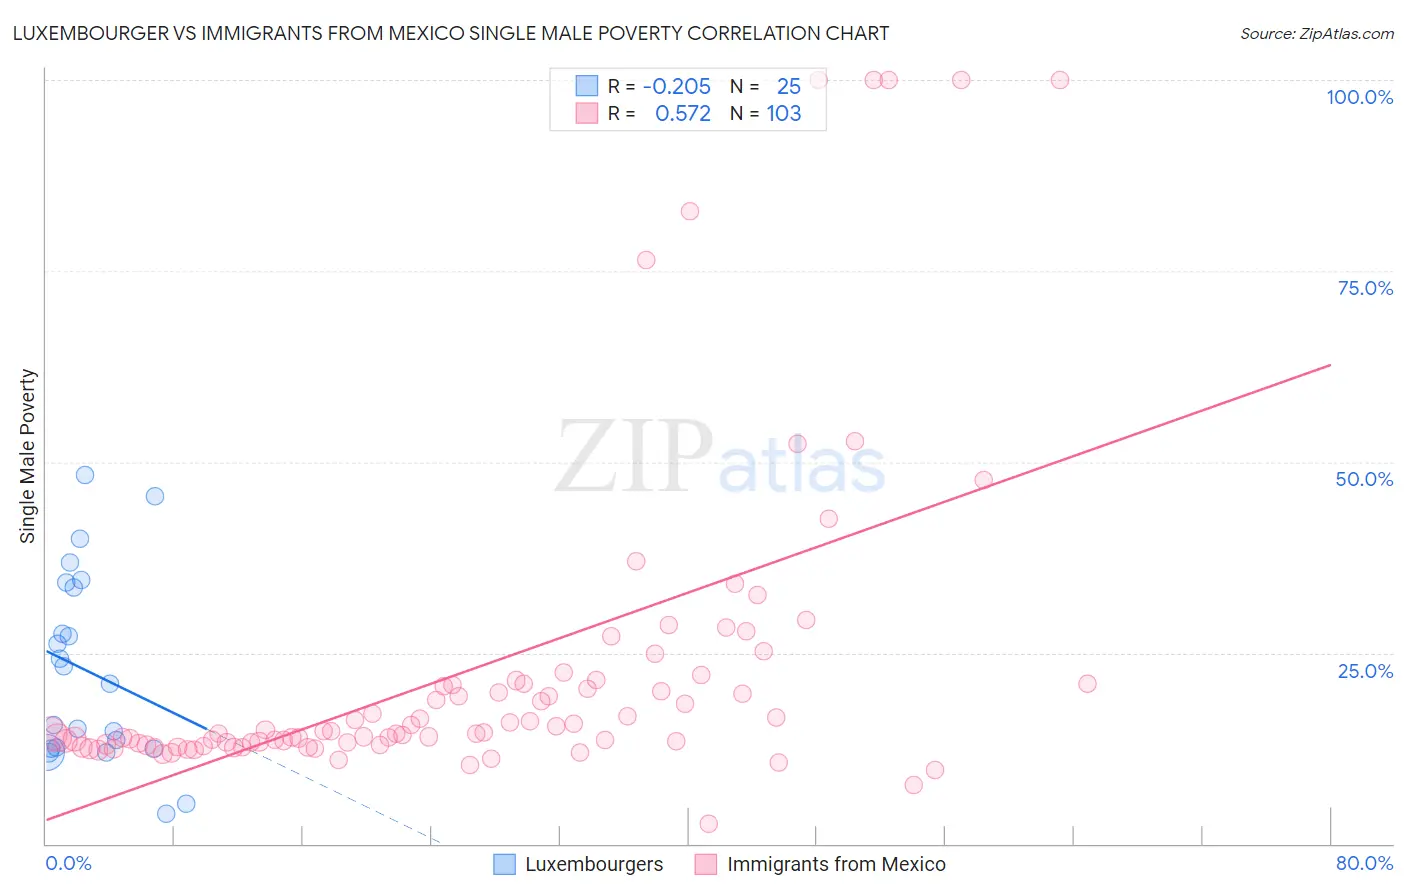
Luxembourger vs Immigrants from Mexico Single Male Poverty Correlation Chart
The statistical analysis conducted on geographies consisting of 133,228,824 people shows a weak negative correlation between the proportion of Luxembourgers and poverty level among single males in the United States with a correlation coefficient (R) of -0.205 and weighted average of 13.4%. Similarly, the statistical analysis conducted on geographies consisting of 441,273,873 people shows a substantial positive correlation between the proportion of Immigrants from Mexico and poverty level among single males in the United States with a correlation coefficient (R) of 0.572 and weighted average of 13.9%, a difference of 4.4%.
Single Male Poverty Correlation Summary
| Measurement | Luxembourger | Immigrants from Mexico |
| Minimum | 4.0% | 2.6% |
| Maximum | 48.3% | 100.0% |
| Range | 44.3% | 97.4% |
| Mean | 22.6% | 22.9% |
| Median | 20.9% | 14.5% |
| Interquartile 25% (IQ1) | 12.5% | 13.0% |
| Interquartile 75% (IQ3) | 33.9% | 21.0% |
| Interquartile Range (IQR) | 21.4% | 8.0% |
| Standard Deviation (Sample) | 12.4% | 21.2% |
| Standard Deviation (Population) | 12.1% | 21.1% |
Similar Demographics by Single Male Poverty
Demographics Similar to Luxembourgers by Single Male Poverty
In terms of single male poverty, the demographic groups most similar to Luxembourgers are Bangladeshi (13.3%, a difference of 0.050%), British West Indian (13.4%, a difference of 0.060%), Canadian (13.3%, a difference of 0.15%), British (13.3%, a difference of 0.16%), and Immigrants from Ghana (13.4%, a difference of 0.16%).
| Demographics | Rating | Rank | Single Male Poverty |
| Europeans | 6.2 /100 | #229 | Tragic 13.3% |
| Ghanaians | 6.1 /100 | #230 | Tragic 13.3% |
| Slavs | 5.3 /100 | #231 | Tragic 13.3% |
| Immigrants | Caribbean | 5.0 /100 | #232 | Tragic 13.3% |
| British | 4.0 /100 | #233 | Tragic 13.3% |
| Canadians | 4.0 /100 | #234 | Tragic 13.3% |
| Bangladeshis | 3.7 /100 | #235 | Tragic 13.3% |
| Luxembourgers | 3.6 /100 | #236 | Tragic 13.4% |
| British West Indians | 3.4 /100 | #237 | Tragic 13.4% |
| Immigrants | Ghana | 3.2 /100 | #238 | Tragic 13.4% |
| Czechoslovakians | 3.0 /100 | #239 | Tragic 13.4% |
| Belizeans | 2.3 /100 | #240 | Tragic 13.4% |
| Immigrants | Germany | 2.1 /100 | #241 | Tragic 13.4% |
| Carpatho Rusyns | 2.1 /100 | #242 | Tragic 13.4% |
| Barbadians | 2.1 /100 | #243 | Tragic 13.4% |
Demographics Similar to Immigrants from Mexico by Single Male Poverty
In terms of single male poverty, the demographic groups most similar to Immigrants from Mexico are German (13.9%, a difference of 0.070%), Scottish (14.0%, a difference of 0.16%), Immigrants from Saudi Arabia (14.0%, a difference of 0.17%), Irish (14.0%, a difference of 0.20%), and Immigrants from Cabo Verde (13.9%, a difference of 0.23%).
| Demographics | Rating | Rank | Single Male Poverty |
| Hungarians | 0.3 /100 | #261 | Tragic 13.8% |
| Fijians | 0.3 /100 | #262 | Tragic 13.8% |
| Cape Verdeans | 0.2 /100 | #263 | Tragic 13.8% |
| West Indians | 0.2 /100 | #264 | Tragic 13.8% |
| Immigrants | Congo | 0.2 /100 | #265 | Tragic 13.9% |
| Immigrants | Cabo Verde | 0.1 /100 | #266 | Tragic 13.9% |
| Germans | 0.1 /100 | #267 | Tragic 13.9% |
| Immigrants | Mexico | 0.1 /100 | #268 | Tragic 13.9% |
| Scottish | 0.1 /100 | #269 | Tragic 14.0% |
| Immigrants | Saudi Arabia | 0.1 /100 | #270 | Tragic 14.0% |
| Irish | 0.1 /100 | #271 | Tragic 14.0% |
| Mexicans | 0.1 /100 | #272 | Tragic 14.0% |
| Welsh | 0.1 /100 | #273 | Tragic 14.0% |
| Hondurans | 0.1 /100 | #274 | Tragic 14.0% |
| English | 0.1 /100 | #275 | Tragic 14.1% |