Luxembourger vs Immigrants from Mexico 3 or more Vehicles in Household
COMPARE
Luxembourger
Immigrants from Mexico
3 or more Vehicles in Household
3 or more Vehicles in Household Comparison
Luxembourgers
Immigrants from Mexico
20.9%
3 OR MORE VEHICLES IN HOUSEHOLD
97.7/ 100
METRIC RATING
104th/ 347
METRIC RANK
24.6%
3 OR MORE VEHICLES IN HOUSEHOLD
100.0/ 100
METRIC RATING
14th/ 347
METRIC RANK
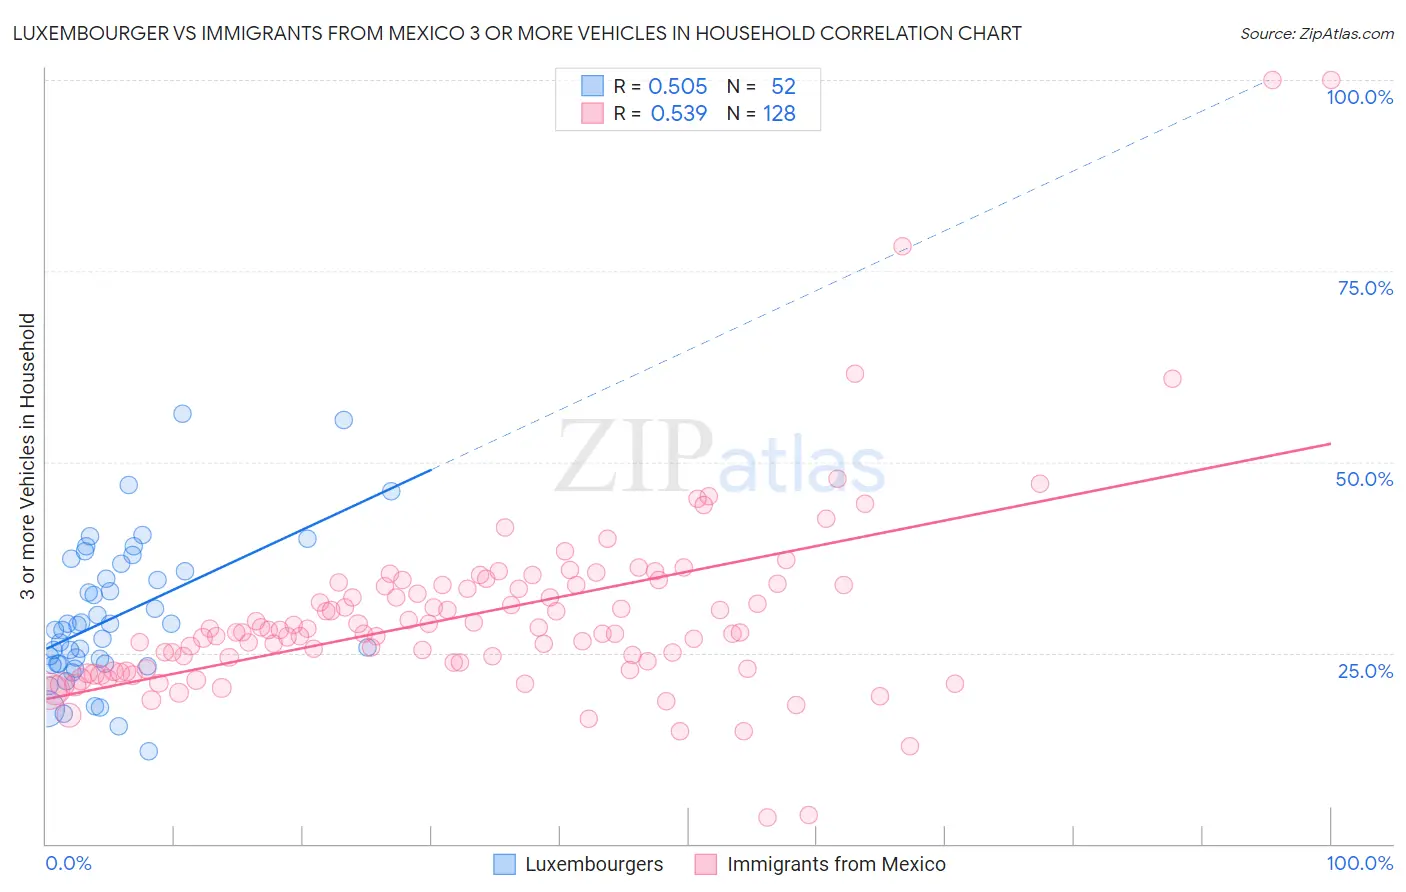
Luxembourger vs Immigrants from Mexico 3 or more Vehicles in Household Correlation Chart
The statistical analysis conducted on geographies consisting of 144,618,677 people shows a substantial positive correlation between the proportion of Luxembourgers and percentage of households with 3 or more vehicles available in the United States with a correlation coefficient (R) of 0.505 and weighted average of 20.9%. Similarly, the statistical analysis conducted on geographies consisting of 513,239,841 people shows a substantial positive correlation between the proportion of Immigrants from Mexico and percentage of households with 3 or more vehicles available in the United States with a correlation coefficient (R) of 0.539 and weighted average of 24.6%, a difference of 17.8%.
3 or more Vehicles in Household Correlation Summary
| Measurement | Luxembourger | Immigrants from Mexico |
| Minimum | 12.2% | 3.4% |
| Maximum | 56.2% | 100.0% |
| Range | 44.1% | 96.6% |
| Mean | 29.8% | 30.1% |
| Median | 28.4% | 27.7% |
| Interquartile 25% (IQ1) | 23.5% | 22.9% |
| Interquartile 75% (IQ3) | 36.2% | 33.9% |
| Interquartile Range (IQR) | 12.7% | 11.0% |
| Standard Deviation (Sample) | 9.4% | 13.1% |
| Standard Deviation (Population) | 9.3% | 13.0% |
Similar Demographics by 3 or more Vehicles in Household
Demographics Similar to Luxembourgers by 3 or more Vehicles in Household
In terms of 3 or more vehicles in household, the demographic groups most similar to Luxembourgers are Dutch West Indian (20.9%, a difference of 0.080%), Austrian (20.9%, a difference of 0.10%), Seminole (20.9%, a difference of 0.12%), Blackfeet (20.9%, a difference of 0.15%), and Bolivian (20.8%, a difference of 0.20%).
| Demographics | Rating | Rank | 3 or more Vehicles in Household |
| Canadians | 98.3 /100 | #97 | Exceptional 21.0% |
| Hmong | 98.2 /100 | #98 | Exceptional 21.0% |
| Alaska Natives | 98.2 /100 | #99 | Exceptional 21.0% |
| Comanche | 98.2 /100 | #100 | Exceptional 21.0% |
| Blackfeet | 97.9 /100 | #101 | Exceptional 20.9% |
| Seminole | 97.8 /100 | #102 | Exceptional 20.9% |
| Dutch West Indians | 97.8 /100 | #103 | Exceptional 20.9% |
| Luxembourgers | 97.7 /100 | #104 | Exceptional 20.9% |
| Austrians | 97.5 /100 | #105 | Exceptional 20.9% |
| Bolivians | 97.4 /100 | #106 | Exceptional 20.8% |
| Immigrants | Germany | 97.4 /100 | #107 | Exceptional 20.8% |
| Immigrants | Scotland | 97.1 /100 | #108 | Exceptional 20.8% |
| Filipinos | 97.0 /100 | #109 | Exceptional 20.8% |
| Asians | 96.8 /100 | #110 | Exceptional 20.8% |
| Immigrants | Micronesia | 96.7 /100 | #111 | Exceptional 20.7% |
Demographics Similar to Immigrants from Mexico by 3 or more Vehicles in Household
In terms of 3 or more vehicles in household, the demographic groups most similar to Immigrants from Mexico are Mexican (24.7%, a difference of 0.44%), Danish (24.7%, a difference of 0.52%), Shoshone (24.9%, a difference of 1.2%), Nepalese (24.9%, a difference of 1.3%), and Hawaiian (24.3%, a difference of 1.4%).
| Demographics | Rating | Rank | 3 or more Vehicles in Household |
| Colville | 100.0 /100 | #7 | Exceptional 25.8% |
| Samoans | 100.0 /100 | #8 | Exceptional 25.0% |
| Native Hawaiians | 100.0 /100 | #9 | Exceptional 24.9% |
| Nepalese | 100.0 /100 | #10 | Exceptional 24.9% |
| Shoshone | 100.0 /100 | #11 | Exceptional 24.9% |
| Danes | 100.0 /100 | #12 | Exceptional 24.7% |
| Mexicans | 100.0 /100 | #13 | Exceptional 24.7% |
| Immigrants | Mexico | 100.0 /100 | #14 | Exceptional 24.6% |
| Hawaiians | 100.0 /100 | #15 | Exceptional 24.3% |
| Basques | 100.0 /100 | #16 | Exceptional 24.3% |
| Koreans | 100.0 /100 | #17 | Exceptional 24.1% |
| Norwegians | 100.0 /100 | #18 | Exceptional 23.9% |
| Chinese | 100.0 /100 | #19 | Exceptional 23.9% |
| Paiute | 100.0 /100 | #20 | Exceptional 23.8% |
| Immigrants | Vietnam | 100.0 /100 | #21 | Exceptional 23.8% |