Luxembourger vs Immigrants from Mexico 9th Grade

COMPARE

Luxembourger
Race
Ancestry
AfghanAfricanAlaska NativeAlaskan AthabascanAlbanianAleutAlsatianAmericanApacheArabArapahoArgentineanArmenianAssyrian/Chaldean/SyriacAustralianAustrianBahamianBangladeshiBarbadianBasqueBelgianBelizeanBermudanBhutaneseBlackfeetBolivianBrazilianBritishBritish West IndianBulgarianBurmeseCajunCambodianCanadianCape VerdeanCarpatho RusynCelticCentral AmericanCentral American IndianCherokeeCheyenneChickasawChileanChineseChippewaChoctawColombianColvilleComancheCosta RicanCreeCreekCroatianCrowCubanCypriotCzechCzechoslovakianDanishDelawareDominicanDutchDutch West IndianEastern EuropeanEcuadorianEgyptianEnglishEstonianEthiopianEuropeanFijianFilipinoFinnishFrenchFrench American IndianFrench CanadianGermanGerman RussianGhanaianGreekGuamanian/ChamorroGuatemalanGuyaneseHaitianHmongHonduranHopiHoumaHungarianIcelanderIndian (Asian)IndonesianInupiatIranianIraqiIrishIroquoisIsraeliItalianJamaicanJapaneseJordanianKenyanKiowaKoreanLaotianLatvianLebaneseLiberianLithuanianLumbeeLuxembourgerMacedonianMalaysianMalteseMarshalleseMenomineeMexicanMexican American IndianMongolianMoroccanNative HawaiianNavajoNepaleseNew ZealanderNicaraguanNigerianNorthern EuropeanNorwegianOkinawanOsageOttawaPaiutePakistaniPalestinianPanamanianParaguayanPennsylvania GermanPeruvianPimaPolishPortuguesePotawatomiPuebloPuerto RicanPuget Sound SalishRomanianRussianSalvadoranSamoanScandinavianScotch-IrishScottishSeminoleSenegaleseSerbianShoshoneSierra LeoneanSiouxSlavicSlovakSloveneSomaliSouth AfricanSouth AmericanSouth American IndianSoviet UnionSpaniardSpanishSpanish AmericanSpanish American IndianSri LankanSubsaharan AfricanSudaneseSwedishSwissSyrianTaiwaneseThaiTlingit-HaidaTohono O'OdhamTonganTrinidadian and TobagonianTsimshianTurkishU.S. Virgin IslanderUgandanUkrainianUruguayanUteVenezuelanVietnameseWelshWest IndianYakamaYaquiYugoslavianYumanYup'ikZimbabwean
Immigration
NonimmigrantsImmigrantsAfghanistanAfricaAlbaniaArgentinaArmeniaAsiaAustraliaAustriaBahamasBangladeshBarbadosBelarusBelgiumBelizeBoliviaBosnia and HerzegovinaBrazilBulgariaBurma/MyanmarCabo VerdeCambodiaCameroonCanadaCaribbeanCentral AmericaChileChinaColombiaCongoCosta RicaCroatiaCubaCzechoslovakiaDenmarkDominicaDominican RepublicEastern AfricaEastern AsiaEastern EuropeEcuadorEgyptEl SalvadorEnglandEritreaEthiopiaEuropeFijiFranceGermanyGhanaGreeceGrenadaGuatemalaGuyanaHaitiHondurasHong KongHungaryIndiaIndonesiaIranIraqIrelandIsraelItalyJamaicaJapanJordanKazakhstanKenyaKoreaKuwaitLaosLatin AmericaLatviaLebanonLiberiaLithuaniaMalaysiaMicronesiaMiddle AfricaMoldovaMoroccoNepalNetherlandsNicaraguaNigeriaNorth AmericaNorth MacedoniaNorthern AfricaNorthern EuropeNorwayOceaniaPakistanPanamaPeruPhilippinesPolandPortugalRomaniaRussiaSaudi ArabiaScotlandSenegalSerbiaSierra LeoneSingaporeSomaliaSouth AfricaSouth AmericaSouth Central AsiaSouth Eastern AsiaSouthern EuropeSpainSri LankaSt. Vincent and the GrenadinesSudanSwedenSwitzerlandSyriaTaiwanThailandTrinidad and TobagoTurkeyUgandaUkraineUruguayUzbekistanVenezuelaVietnamWest IndiesWestern AfricaWestern AsiaWestern EuropeYemenZaireZimbabweAzores
Immigrants from Mexico
Race
Ancestry
AfghanAfricanAlaska NativeAlaskan AthabascanAlbanianAleutAlsatianAmericanApacheArabArapahoArgentineanArmenianAssyrian/Chaldean/SyriacAustralianAustrianBahamianBangladeshiBarbadianBasqueBelgianBelizeanBermudanBhutaneseBlackfeetBolivianBrazilianBritishBritish West IndianBulgarianBurmeseCajunCambodianCanadianCape VerdeanCarpatho RusynCelticCentral AmericanCentral American IndianCherokeeCheyenneChickasawChileanChineseChippewaChoctawColombianColvilleComancheCosta RicanCreeCreekCroatianCrowCubanCypriotCzechCzechoslovakianDanishDelawareDominicanDutchDutch West IndianEastern EuropeanEcuadorianEgyptianEnglishEstonianEthiopianEuropeanFijianFilipinoFinnishFrenchFrench American IndianFrench CanadianGermanGerman RussianGhanaianGreekGuamanian/ChamorroGuatemalanGuyaneseHaitianHmongHonduranHopiHoumaHungarianIcelanderIndian (Asian)IndonesianInupiatIranianIraqiIrishIroquoisIsraeliItalianJamaicanJapaneseJordanianKenyanKiowaKoreanLaotianLatvianLebaneseLiberianLithuanianLumbeeMacedonianMalaysianMalteseMarshalleseMenomineeMexicanMexican American IndianMongolianMoroccanNative HawaiianNavajoNepaleseNew ZealanderNicaraguanNigerianNorthern EuropeanNorwegianOkinawanOsageOttawaPaiutePakistaniPalestinianPanamanianParaguayanPennsylvania GermanPeruvianPimaPolishPortuguesePotawatomiPuebloPuerto RicanPuget Sound SalishRomanianRussianSalvadoranSamoanScandinavianScotch-IrishScottishSeminoleSenegaleseSerbianShoshoneSierra LeoneanSiouxSlavicSlovakSloveneSomaliSouth AfricanSouth AmericanSouth American IndianSoviet UnionSpaniardSpanishSpanish AmericanSpanish American IndianSri LankanSubsaharan AfricanSudaneseSwedishSwissSyrianTaiwaneseThaiTlingit-HaidaTohono O'OdhamTonganTrinidadian and TobagonianTsimshianTurkishU.S. Virgin IslanderUgandanUkrainianUruguayanUteVenezuelanVietnameseWelshWest IndianYakamaYaquiYugoslavianYumanYup'ikZimbabwean
Immigration
NonimmigrantsImmigrantsAfghanistanAfricaAlbaniaArgentinaArmeniaAsiaAustraliaAustriaBahamasBangladeshBarbadosBelarusBelgiumBelizeBoliviaBosnia and HerzegovinaBrazilBulgariaBurma/MyanmarCabo VerdeCambodiaCameroonCanadaCaribbeanCentral AmericaChileChinaColombiaCongoCosta RicaCroatiaCubaCzechoslovakiaDenmarkDominicaDominican RepublicEastern AfricaEastern AsiaEastern EuropeEcuadorEgyptEl SalvadorEnglandEritreaEthiopiaEuropeFijiFranceGermanyGhanaGreeceGrenadaGuatemalaGuyanaHaitiHondurasHong KongHungaryIndiaIndonesiaIranIraqIrelandIsraelItalyJamaicaJapanJordanKazakhstanKenyaKoreaKuwaitLaosLatin AmericaLatviaLebanonLiberiaLithuaniaMalaysiaMexicoMicronesiaMiddle AfricaMoldovaMoroccoNepalNetherlandsNicaraguaNigeriaNorth AmericaNorth MacedoniaNorthern AfricaNorthern EuropeNorwayOceaniaPakistanPanamaPeruPhilippinesPolandPortugalRomaniaRussiaSaudi ArabiaScotlandSenegalSerbiaSierra LeoneSingaporeSomaliaSouth AfricaSouth AmericaSouth Central AsiaSouth Eastern AsiaSouthern EuropeSpainSri LankaSt. Vincent and the GrenadinesSudanSwedenSwitzerlandSyriaTaiwanThailandTrinidad and TobagoTurkeyUgandaUkraineUruguayUzbekistanVenezuelaVietnamWest IndiesWestern AfricaWestern AsiaWestern EuropeYemenZaireZimbabweAzores
9th Grade
Income
Poverty
Unemployment
Labor Participation
Family Structure
Vehicle Availability
Education Level
Disability

9th Grade Comparison

Luxembourgers

Immigrants from Mexico

Exceptional
Tragic
96.3%
9TH GRADE
100.0/ 100
METRIC RATING
33rd/ 347
METRIC RANK
88.7%
9TH GRADE
0.0/ 100
METRIC RATING
346th/ 347
METRIC RANK

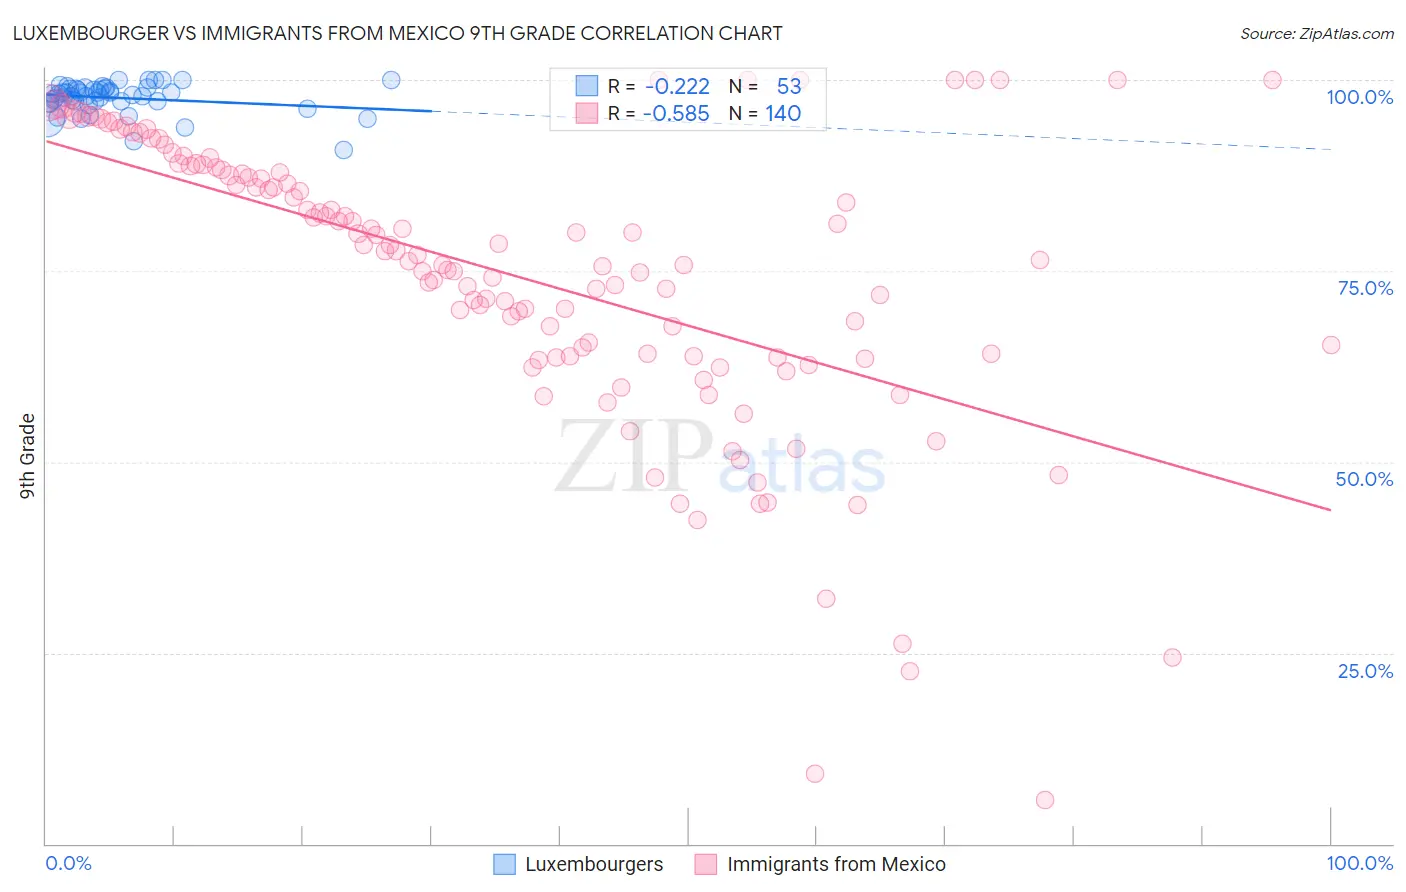
Luxembourger vs Immigrants from Mexico 9th Grade Correlation Chart

The statistical analysis conducted on geographies consisting of 144,676,190 people shows a weak negative correlation between the proportion of Luxembourgers and percentage of population with at least 9th grade education in the United States with a correlation coefficient (R) of -0.222 and weighted average of 96.3%. Similarly, the statistical analysis conducted on geographies consisting of 513,766,901 people shows a substantial negative correlation between the proportion of Immigrants from Mexico and percentage of population with at least 9th grade education in the United States with a correlation coefficient (R) of -0.585 and weighted average of 88.7%, a difference of 8.6%.
Luxembourger vs Immigrants from Mexico 9th Grade

9th Grade Correlation Summary

MeasurementLuxembourgerImmigrants from Mexico
Minimum90.8%5.7%
Maximum100.0%100.0%
Range9.2%94.3%
Mean97.7%74.4%
Median98.1%76.8%
Interquartile 25% (IQ1)97.1%63.8%
Interquartile 75% (IQ3)98.9%88.4%
Interquartile Range (IQR)1.8%24.6%
Standard Deviation (Sample)1.9%18.8%
Standard Deviation (Population)1.9%18.7%

Similar Demographics by 9th Grade

Demographics Similar to Luxembourgers by 9th Grade

In terms of 9th grade, the demographic groups most similar to Luxembourgers are British (96.3%, a difference of 0.010%), Belgian (96.3%, a difference of 0.010%), Maltese (96.3%, a difference of 0.020%), Hungarian (96.2%, a difference of 0.030%), and Chinese (96.3%, a difference of 0.040%).
DemographicsRating | Rank9th Grade
French Canadians
100.0
/100
|
#26
Exceptional
96.3%
Scotch-Irish
100.0
/100
|
#27
Exceptional
96.3%
Eastern Europeans
100.0
/100
|
#28
Exceptional
96.3%
Chinese
100.0
/100
|
#29
Exceptional
96.3%
Maltese
100.0
/100
|
#30
Exceptional
96.3%
British
100.0
/100
|
#31
Exceptional
96.3%
Belgians
100.0
/100
|
#32
Exceptional
96.3%
Luxembourgers
100.0
/100
|
#33
Exceptional
96.3%
Hungarians
100.0
/100
|
#34
Exceptional
96.2%
Bulgarians
99.9
/100
|
#35
Exceptional
96.2%
Northern Europeans
99.9
/100
|
#36
Exceptional
96.2%
Estonians
99.9
/100
|
#37
Exceptional
96.1%
Immigrants | Scotland
99.9
/100
|
#38
Exceptional
96.1%
Ottawa
99.9
/100
|
#39
Exceptional
96.1%
Slavs
99.9
/100
|
#40
Exceptional
96.1%

Demographics Similar to Immigrants from Mexico by 9th Grade

In terms of 9th grade, the demographic groups most similar to Immigrants from Mexico are Immigrants from Central America (89.0%, a difference of 0.34%), Immigrants from El Salvador (89.0%, a difference of 0.36%), Spanish American Indian (88.3%, a difference of 0.43%), Immigrants from Guatemala (89.4%, a difference of 0.87%), and Salvadoran (89.6%, a difference of 1.1%).
DemographicsRating | Rank9th Grade
Immigrants | Yemen
0.0
/100
|
#333
Tragic
90.8%
Immigrants | Azores
0.0
/100
|
#334
Tragic
90.8%
Immigrants | Honduras
0.0
/100
|
#335
Tragic
90.6%
Immigrants | Dominican Republic
0.0
/100
|
#336
Tragic
90.5%
Immigrants | Latin America
0.0
/100
|
#337
Tragic
90.4%
Central Americans
0.0
/100
|
#338
Tragic
90.4%
Yakama
0.0
/100
|
#339
Tragic
90.1%
Mexicans
0.0
/100
|
#340
Tragic
90.0%
Guatemalans
0.0
/100
|
#341
Tragic
89.9%
Salvadorans
0.0
/100
|
#342
Tragic
89.6%
Immigrants | Guatemala
0.0
/100
|
#343
Tragic
89.4%
Immigrants | El Salvador
0.0
/100
|
#344
Tragic
89.0%
Immigrants | Central America
0.0
/100
|
#345
Tragic
89.0%
Immigrants | Mexico
0.0
/100
|
#346
Tragic
88.7%
Spanish American Indians
0.0
/100
|
#347
Tragic
88.3%