Luxembourger vs Immigrants from Oceania Single Male Poverty
COMPARE
Luxembourger
Immigrants from Oceania
Single Male Poverty
Single Male Poverty Comparison
Luxembourgers
Immigrants from Oceania
13.4%
SINGLE MALE POVERTY
3.6/ 100
METRIC RATING
236th/ 347
METRIC RANK
12.4%
SINGLE MALE POVERTY
91.1/ 100
METRIC RATING
117th/ 347
METRIC RANK
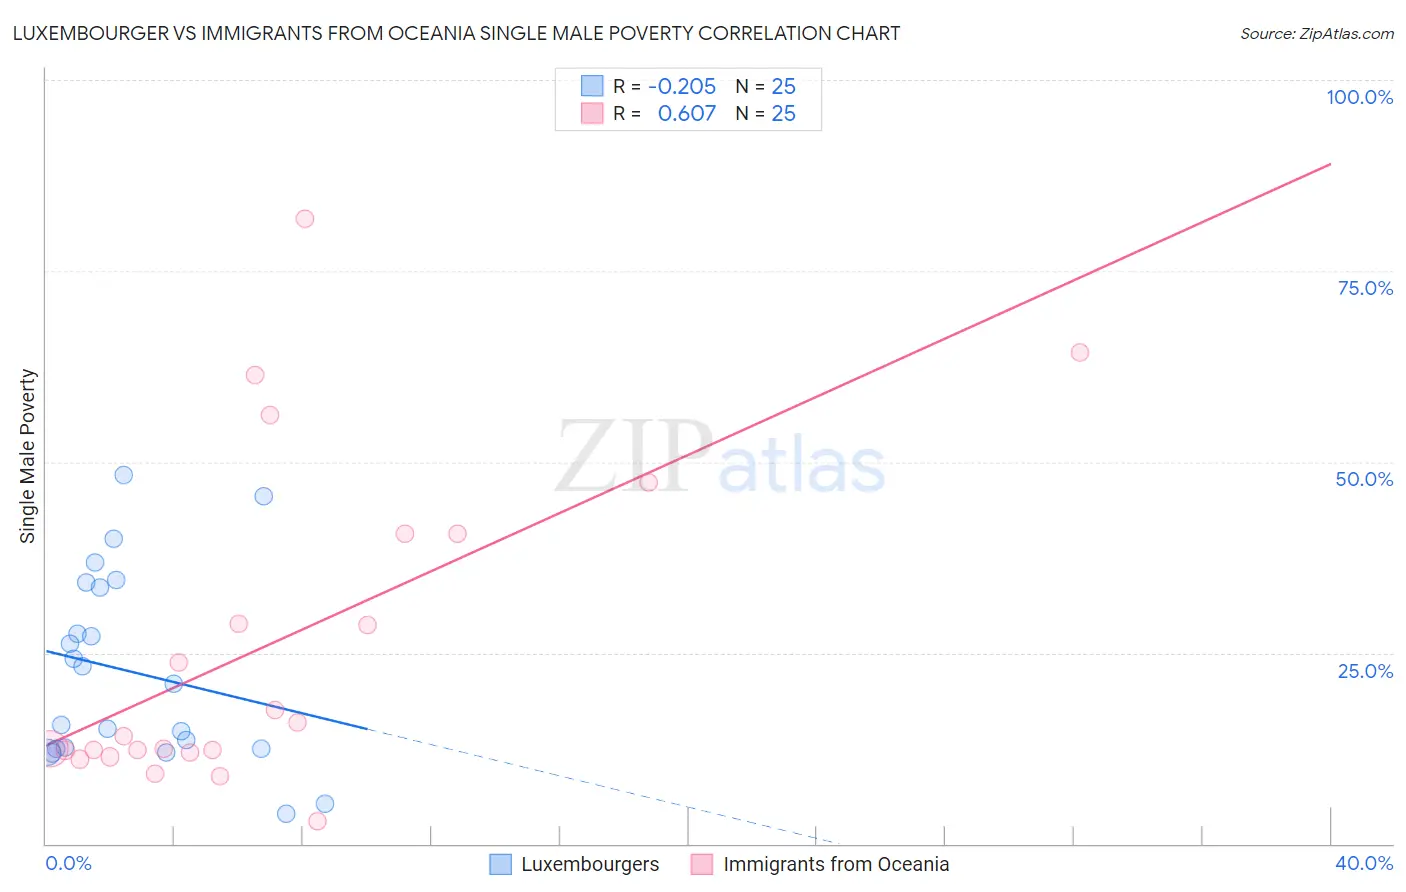
Luxembourger vs Immigrants from Oceania Single Male Poverty Correlation Chart
The statistical analysis conducted on geographies consisting of 133,228,824 people shows a weak negative correlation between the proportion of Luxembourgers and poverty level among single males in the United States with a correlation coefficient (R) of -0.205 and weighted average of 13.4%. Similarly, the statistical analysis conducted on geographies consisting of 275,455,617 people shows a significant positive correlation between the proportion of Immigrants from Oceania and poverty level among single males in the United States with a correlation coefficient (R) of 0.607 and weighted average of 12.4%, a difference of 7.6%.
Single Male Poverty Correlation Summary
| Measurement | Luxembourger | Immigrants from Oceania |
| Minimum | 4.0% | 3.0% |
| Maximum | 48.3% | 81.8% |
| Range | 44.3% | 78.9% |
| Mean | 22.6% | 26.0% |
| Median | 20.9% | 14.1% |
| Interquartile 25% (IQ1) | 12.5% | 12.1% |
| Interquartile 75% (IQ3) | 33.9% | 40.5% |
| Interquartile Range (IQR) | 21.4% | 28.4% |
| Standard Deviation (Sample) | 12.4% | 21.2% |
| Standard Deviation (Population) | 12.1% | 20.8% |
Similar Demographics by Single Male Poverty
Demographics Similar to Luxembourgers by Single Male Poverty
In terms of single male poverty, the demographic groups most similar to Luxembourgers are Bangladeshi (13.3%, a difference of 0.050%), British West Indian (13.4%, a difference of 0.060%), Canadian (13.3%, a difference of 0.15%), British (13.3%, a difference of 0.16%), and Immigrants from Ghana (13.4%, a difference of 0.16%).
| Demographics | Rating | Rank | Single Male Poverty |
| Europeans | 6.2 /100 | #229 | Tragic 13.3% |
| Ghanaians | 6.1 /100 | #230 | Tragic 13.3% |
| Slavs | 5.3 /100 | #231 | Tragic 13.3% |
| Immigrants | Caribbean | 5.0 /100 | #232 | Tragic 13.3% |
| British | 4.0 /100 | #233 | Tragic 13.3% |
| Canadians | 4.0 /100 | #234 | Tragic 13.3% |
| Bangladeshis | 3.7 /100 | #235 | Tragic 13.3% |
| Luxembourgers | 3.6 /100 | #236 | Tragic 13.4% |
| British West Indians | 3.4 /100 | #237 | Tragic 13.4% |
| Immigrants | Ghana | 3.2 /100 | #238 | Tragic 13.4% |
| Czechoslovakians | 3.0 /100 | #239 | Tragic 13.4% |
| Belizeans | 2.3 /100 | #240 | Tragic 13.4% |
| Immigrants | Germany | 2.1 /100 | #241 | Tragic 13.4% |
| Carpatho Rusyns | 2.1 /100 | #242 | Tragic 13.4% |
| Barbadians | 2.1 /100 | #243 | Tragic 13.4% |
Demographics Similar to Immigrants from Oceania by Single Male Poverty
In terms of single male poverty, the demographic groups most similar to Immigrants from Oceania are Immigrants from Syria (12.4%, a difference of 0.010%), Immigrants from Southern Europe (12.4%, a difference of 0.070%), Albanian (12.4%, a difference of 0.10%), Immigrants from Albania (12.4%, a difference of 0.13%), and Nicaraguan (12.4%, a difference of 0.18%).
| Demographics | Rating | Rank | Single Male Poverty |
| Immigrants | Portugal | 93.6 /100 | #110 | Exceptional 12.3% |
| Immigrants | North Macedonia | 93.6 /100 | #111 | Exceptional 12.3% |
| Kenyans | 93.3 /100 | #112 | Exceptional 12.4% |
| Pakistanis | 92.4 /100 | #113 | Exceptional 12.4% |
| Nicaraguans | 92.1 /100 | #114 | Exceptional 12.4% |
| Immigrants | Southern Europe | 91.5 /100 | #115 | Exceptional 12.4% |
| Immigrants | Syria | 91.2 /100 | #116 | Exceptional 12.4% |
| Immigrants | Oceania | 91.1 /100 | #117 | Exceptional 12.4% |
| Albanians | 90.6 /100 | #118 | Exceptional 12.4% |
| Immigrants | Albania | 90.3 /100 | #119 | Exceptional 12.4% |
| Venezuelans | 89.4 /100 | #120 | Excellent 12.4% |
| Icelanders | 88.2 /100 | #121 | Excellent 12.5% |
| Serbians | 87.9 /100 | #122 | Excellent 12.5% |
| Immigrants | Kenya | 87.6 /100 | #123 | Excellent 12.5% |
| Russians | 87.3 /100 | #124 | Excellent 12.5% |