Luxembourger vs Immigrants from Chile Single Male Poverty
COMPARE
Luxembourger
Immigrants from Chile
Single Male Poverty
Single Male Poverty Comparison
Luxembourgers
Immigrants from Chile
13.4%
SINGLE MALE POVERTY
3.6/ 100
METRIC RATING
236th/ 347
METRIC RANK
12.1%
SINGLE MALE POVERTY
98.6/ 100
METRIC RATING
83rd/ 347
METRIC RANK
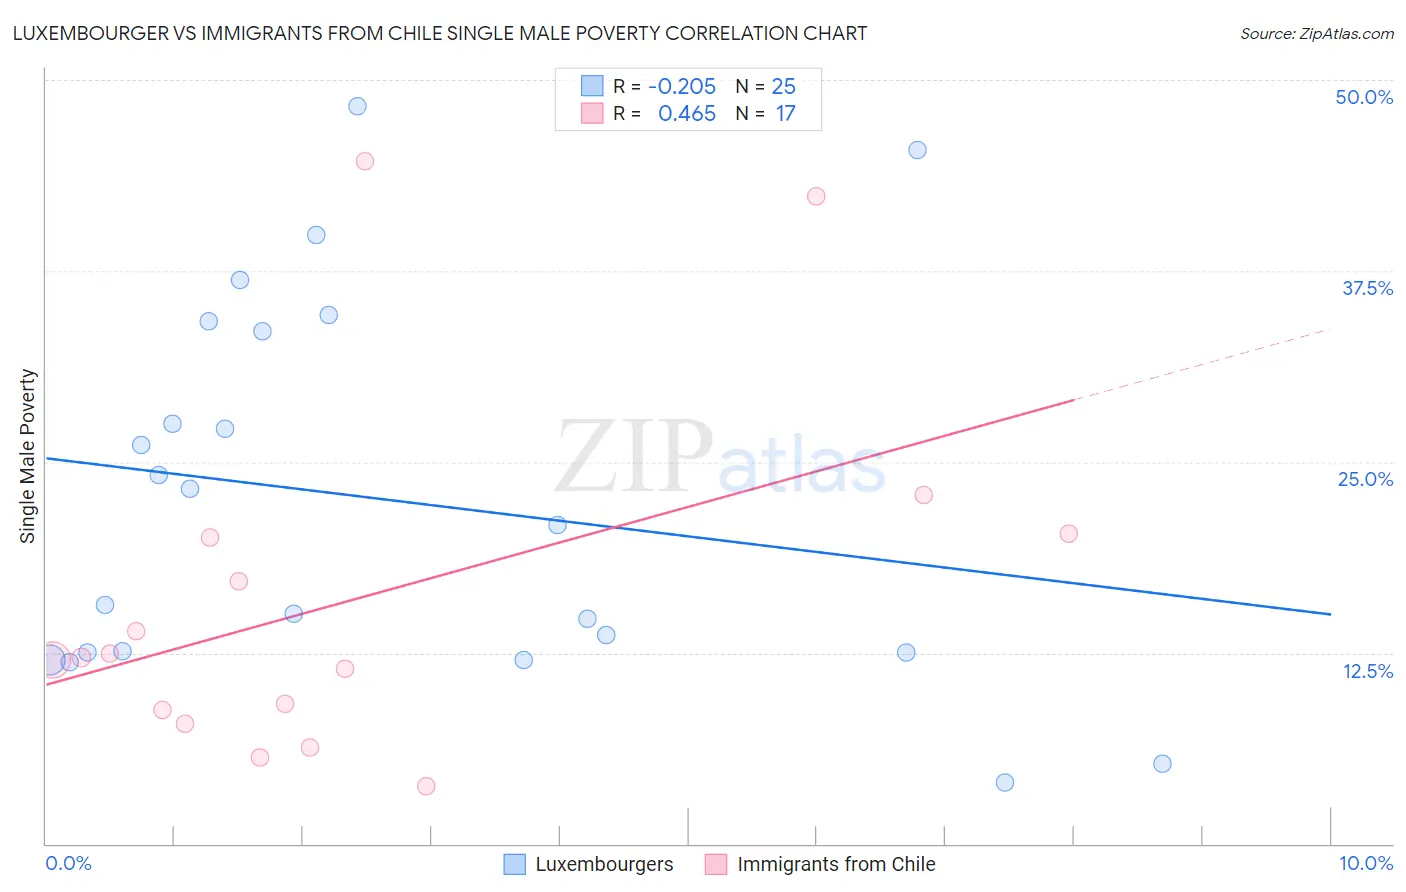
Luxembourger vs Immigrants from Chile Single Male Poverty Correlation Chart
The statistical analysis conducted on geographies consisting of 133,228,824 people shows a weak negative correlation between the proportion of Luxembourgers and poverty level among single males in the United States with a correlation coefficient (R) of -0.205 and weighted average of 13.4%. Similarly, the statistical analysis conducted on geographies consisting of 202,893,830 people shows a moderate positive correlation between the proportion of Immigrants from Chile and poverty level among single males in the United States with a correlation coefficient (R) of 0.465 and weighted average of 12.1%, a difference of 10.5%.
Single Male Poverty Correlation Summary
| Measurement | Luxembourger | Immigrants from Chile |
| Minimum | 4.0% | 3.8% |
| Maximum | 48.3% | 44.7% |
| Range | 44.3% | 40.9% |
| Mean | 22.6% | 15.9% |
| Median | 20.9% | 12.2% |
| Interquartile 25% (IQ1) | 12.5% | 8.3% |
| Interquartile 75% (IQ3) | 33.9% | 20.2% |
| Interquartile Range (IQR) | 21.4% | 11.9% |
| Standard Deviation (Sample) | 12.4% | 11.7% |
| Standard Deviation (Population) | 12.1% | 11.3% |
Similar Demographics by Single Male Poverty
Demographics Similar to Luxembourgers by Single Male Poverty
In terms of single male poverty, the demographic groups most similar to Luxembourgers are Bangladeshi (13.3%, a difference of 0.050%), British West Indian (13.4%, a difference of 0.060%), Canadian (13.3%, a difference of 0.15%), British (13.3%, a difference of 0.16%), and Immigrants from Ghana (13.4%, a difference of 0.16%).
| Demographics | Rating | Rank | Single Male Poverty |
| Europeans | 6.2 /100 | #229 | Tragic 13.3% |
| Ghanaians | 6.1 /100 | #230 | Tragic 13.3% |
| Slavs | 5.3 /100 | #231 | Tragic 13.3% |
| Immigrants | Caribbean | 5.0 /100 | #232 | Tragic 13.3% |
| British | 4.0 /100 | #233 | Tragic 13.3% |
| Canadians | 4.0 /100 | #234 | Tragic 13.3% |
| Bangladeshis | 3.7 /100 | #235 | Tragic 13.3% |
| Luxembourgers | 3.6 /100 | #236 | Tragic 13.4% |
| British West Indians | 3.4 /100 | #237 | Tragic 13.4% |
| Immigrants | Ghana | 3.2 /100 | #238 | Tragic 13.4% |
| Czechoslovakians | 3.0 /100 | #239 | Tragic 13.4% |
| Belizeans | 2.3 /100 | #240 | Tragic 13.4% |
| Immigrants | Germany | 2.1 /100 | #241 | Tragic 13.4% |
| Carpatho Rusyns | 2.1 /100 | #242 | Tragic 13.4% |
| Barbadians | 2.1 /100 | #243 | Tragic 13.4% |
Demographics Similar to Immigrants from Chile by Single Male Poverty
In terms of single male poverty, the demographic groups most similar to Immigrants from Chile are Immigrants from Colombia (12.1%, a difference of 0.0%), Immigrants from Czechoslovakia (12.1%, a difference of 0.020%), Immigrants from South America (12.1%, a difference of 0.060%), Armenian (12.1%, a difference of 0.080%), and Turkish (12.1%, a difference of 0.10%).
| Demographics | Rating | Rank | Single Male Poverty |
| Immigrants | Northern Africa | 99.4 /100 | #76 | Exceptional 11.9% |
| Immigrants | Malaysia | 99.2 /100 | #77 | Exceptional 12.0% |
| Immigrants | Venezuela | 99.1 /100 | #78 | Exceptional 12.0% |
| Immigrants | Belgium | 99.0 /100 | #79 | Exceptional 12.0% |
| Armenians | 98.7 /100 | #80 | Exceptional 12.1% |
| Immigrants | South America | 98.7 /100 | #81 | Exceptional 12.1% |
| Immigrants | Colombia | 98.6 /100 | #82 | Exceptional 12.1% |
| Immigrants | Chile | 98.6 /100 | #83 | Exceptional 12.1% |
| Immigrants | Czechoslovakia | 98.6 /100 | #84 | Exceptional 12.1% |
| Turks | 98.5 /100 | #85 | Exceptional 12.1% |
| Immigrants | Israel | 98.5 /100 | #86 | Exceptional 12.1% |
| South Americans | 98.5 /100 | #87 | Exceptional 12.1% |
| Immigrants | Eritrea | 98.5 /100 | #88 | Exceptional 12.1% |
| Immigrants | Ireland | 98.3 /100 | #89 | Exceptional 12.1% |
| South American Indians | 98.3 /100 | #90 | Exceptional 12.1% |