Immigrants from Europe vs Immigrants from Chile Single Male Poverty
COMPARE
Immigrants from Europe
Immigrants from Chile
Single Male Poverty
Single Male Poverty Comparison
Immigrants from Europe
Immigrants from Chile
12.2%
SINGLE MALE POVERTY
97.0/ 100
METRIC RATING
102nd/ 347
METRIC RANK
12.1%
SINGLE MALE POVERTY
98.6/ 100
METRIC RATING
83rd/ 347
METRIC RANK
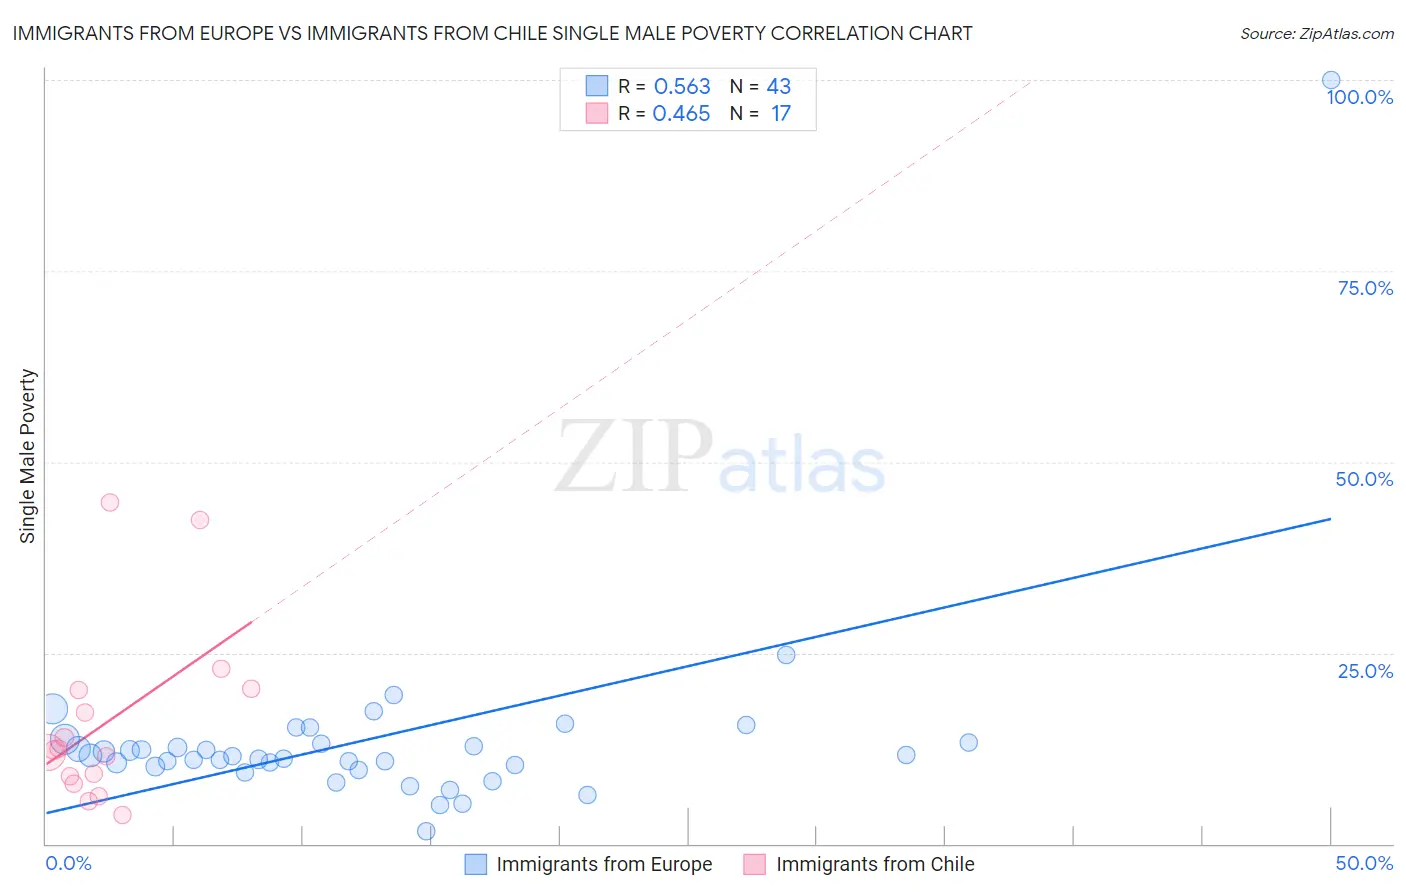
Immigrants from Europe vs Immigrants from Chile Single Male Poverty Correlation Chart
The statistical analysis conducted on geographies consisting of 459,031,824 people shows a substantial positive correlation between the proportion of Immigrants from Europe and poverty level among single males in the United States with a correlation coefficient (R) of 0.563 and weighted average of 12.2%. Similarly, the statistical analysis conducted on geographies consisting of 202,893,830 people shows a moderate positive correlation between the proportion of Immigrants from Chile and poverty level among single males in the United States with a correlation coefficient (R) of 0.465 and weighted average of 12.1%, a difference of 1.1%.
Single Male Poverty Correlation Summary
| Measurement | Immigrants from Europe | Immigrants from Chile |
| Minimum | 1.6% | 3.8% |
| Maximum | 100.0% | 44.7% |
| Range | 98.4% | 40.9% |
| Mean | 13.7% | 15.9% |
| Median | 11.5% | 12.2% |
| Interquartile 25% (IQ1) | 10.1% | 8.3% |
| Interquartile 75% (IQ3) | 13.3% | 20.2% |
| Interquartile Range (IQR) | 3.2% | 11.9% |
| Standard Deviation (Sample) | 14.1% | 11.7% |
| Standard Deviation (Population) | 13.9% | 11.3% |
Demographics Similar to Immigrants from Europe and Immigrants from Chile by Single Male Poverty
In terms of single male poverty, the demographic groups most similar to Immigrants from Europe are Immigrants from Latvia (12.2%, a difference of 0.010%), Immigrants from Australia (12.2%, a difference of 0.040%), Immigrants from Cuba (12.2%, a difference of 0.16%), Immigrants from Italy (12.2%, a difference of 0.20%), and Guamanian/Chamorro (12.2%, a difference of 0.20%). Similarly, the demographic groups most similar to Immigrants from Chile are Immigrants from Colombia (12.1%, a difference of 0.0%), Immigrants from Czechoslovakia (12.1%, a difference of 0.020%), Turkish (12.1%, a difference of 0.10%), Immigrants from Israel (12.1%, a difference of 0.12%), and South American (12.1%, a difference of 0.13%).
| Demographics | Rating | Rank | Single Male Poverty |
| Immigrants | Colombia | 98.6 /100 | #82 | Exceptional 12.1% |
| Immigrants | Chile | 98.6 /100 | #83 | Exceptional 12.1% |
| Immigrants | Czechoslovakia | 98.6 /100 | #84 | Exceptional 12.1% |
| Turks | 98.5 /100 | #85 | Exceptional 12.1% |
| Immigrants | Israel | 98.5 /100 | #86 | Exceptional 12.1% |
| South Americans | 98.5 /100 | #87 | Exceptional 12.1% |
| Immigrants | Eritrea | 98.5 /100 | #88 | Exceptional 12.1% |
| Immigrants | Ireland | 98.3 /100 | #89 | Exceptional 12.1% |
| South American Indians | 98.3 /100 | #90 | Exceptional 12.1% |
| Immigrants | Turkey | 98.2 /100 | #91 | Exceptional 12.1% |
| Spanish American Indians | 98.0 /100 | #92 | Exceptional 12.1% |
| Immigrants | Bosnia and Herzegovina | 97.9 /100 | #93 | Exceptional 12.1% |
| Colombians | 97.8 /100 | #94 | Exceptional 12.2% |
| Mongolians | 97.7 /100 | #95 | Exceptional 12.2% |
| Immigrants | Sweden | 97.5 /100 | #96 | Exceptional 12.2% |
| Immigrants | Italy | 97.4 /100 | #97 | Exceptional 12.2% |
| Guamanians/Chamorros | 97.4 /100 | #98 | Exceptional 12.2% |
| Immigrants | Cuba | 97.3 /100 | #99 | Exceptional 12.2% |
| Immigrants | Australia | 97.1 /100 | #100 | Exceptional 12.2% |
| Immigrants | Latvia | 97.0 /100 | #101 | Exceptional 12.2% |
| Immigrants | Europe | 97.0 /100 | #102 | Exceptional 12.2% |