Japanese vs Immigrants from Peru Married-Couple Family Poverty
COMPARE
Japanese
Immigrants from Peru
Married-Couple Family Poverty
Married-Couple Family Poverty Comparison
Japanese
Immigrants from Peru
5.6%
MARRIED-COUPLE FAMILY POVERTY
9.8/ 100
METRIC RATING
219th/ 347
METRIC RANK
5.4%
MARRIED-COUPLE FAMILY POVERTY
21.8/ 100
METRIC RATING
203rd/ 347
METRIC RANK
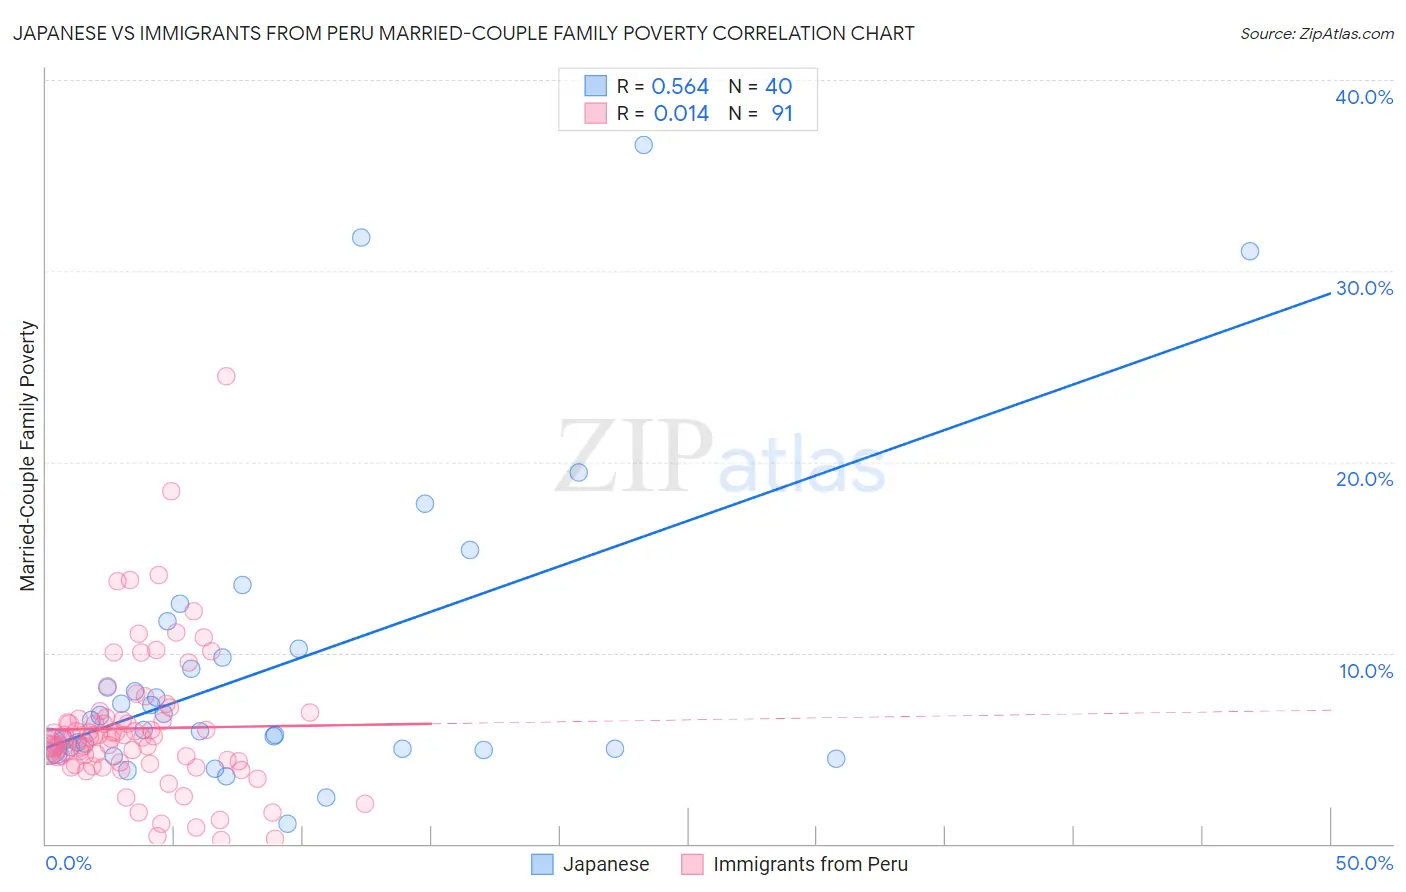
Japanese vs Immigrants from Peru Married-Couple Family Poverty Correlation Chart
The statistical analysis conducted on geographies consisting of 247,969,020 people shows a substantial positive correlation between the proportion of Japanese and poverty level among married-couple families in the United States with a correlation coefficient (R) of 0.564 and weighted average of 5.6%. Similarly, the statistical analysis conducted on geographies consisting of 326,893,317 people shows no correlation between the proportion of Immigrants from Peru and poverty level among married-couple families in the United States with a correlation coefficient (R) of 0.014 and weighted average of 5.4%, a difference of 2.6%.
Married-Couple Family Poverty Correlation Summary
| Measurement | Japanese | Immigrants from Peru |
| Minimum | 1.1% | 0.19% |
| Maximum | 36.6% | 24.5% |
| Range | 35.5% | 24.3% |
| Mean | 9.3% | 6.0% |
| Median | 6.2% | 5.6% |
| Interquartile 25% (IQ1) | 5.0% | 4.2% |
| Interquartile 75% (IQ3) | 10.0% | 6.6% |
| Interquartile Range (IQR) | 5.0% | 2.3% |
| Standard Deviation (Sample) | 8.0% | 3.7% |
| Standard Deviation (Population) | 7.9% | 3.7% |
Demographics Similar to Japanese and Immigrants from Peru by Married-Couple Family Poverty
In terms of married-couple family poverty, the demographic groups most similar to Japanese are Colombian (5.6%, a difference of 0.19%), Panamanian (5.6%, a difference of 0.21%), Afghan (5.5%, a difference of 0.40%), Immigrants from Nigeria (5.5%, a difference of 0.42%), and Potawatomi (5.5%, a difference of 0.71%). Similarly, the demographic groups most similar to Immigrants from Peru are Immigrants from Middle Africa (5.4%, a difference of 0.32%), Lebanese (5.4%, a difference of 0.38%), Immigrants from Costa Rica (5.4%, a difference of 0.41%), Chippewa (5.4%, a difference of 0.49%), and Osage (5.4%, a difference of 0.60%).
| Demographics | Rating | Rank | Married-Couple Family Poverty |
| Lebanese | 24.1 /100 | #201 | Fair 5.4% |
| Immigrants | Middle Africa | 23.8 /100 | #202 | Fair 5.4% |
| Immigrants | Peru | 21.8 /100 | #203 | Fair 5.4% |
| Immigrants | Costa Rica | 19.4 /100 | #204 | Poor 5.4% |
| Chippewa | 18.9 /100 | #205 | Poor 5.4% |
| Osage | 18.4 /100 | #206 | Poor 5.4% |
| Immigrants | Africa | 17.6 /100 | #207 | Poor 5.5% |
| French American Indians | 16.1 /100 | #208 | Poor 5.5% |
| Immigrants | Syria | 15.4 /100 | #209 | Poor 5.5% |
| Immigrants | Micronesia | 14.4 /100 | #210 | Poor 5.5% |
| Nigerians | 14.3 /100 | #211 | Poor 5.5% |
| Immigrants | Thailand | 14.0 /100 | #212 | Poor 5.5% |
| Immigrants | Liberia | 13.3 /100 | #213 | Poor 5.5% |
| Iroquois | 13.1 /100 | #214 | Poor 5.5% |
| Armenians | 12.8 /100 | #215 | Poor 5.5% |
| Potawatomi | 12.4 /100 | #216 | Poor 5.5% |
| Immigrants | Nigeria | 11.3 /100 | #217 | Poor 5.5% |
| Afghans | 11.2 /100 | #218 | Poor 5.5% |
| Japanese | 9.8 /100 | #219 | Tragic 5.6% |
| Colombians | 9.2 /100 | #220 | Tragic 5.6% |
| Panamanians | 9.2 /100 | #221 | Tragic 5.6% |