Japanese vs Immigrants from Hungary Family Poverty
COMPARE
Japanese
Immigrants from Hungary
Family Poverty
Family Poverty Comparison
Japanese
Immigrants from Hungary
9.9%
FAMILY POVERTY
4.8/ 100
METRIC RATING
222nd/ 347
METRIC RANK
8.4%
FAMILY POVERTY
89.9/ 100
METRIC RATING
127th/ 347
METRIC RANK
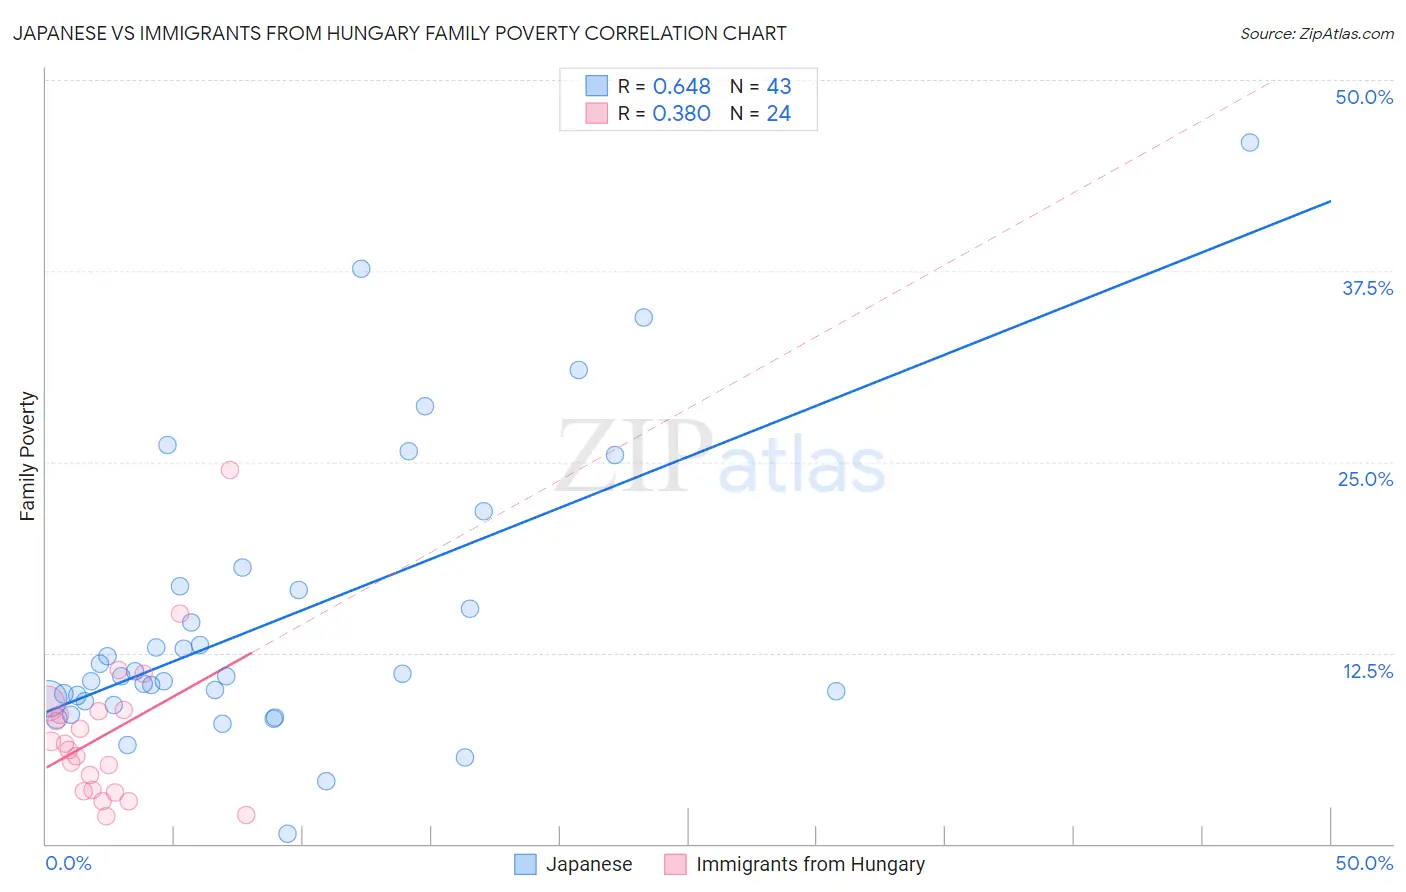
Japanese vs Immigrants from Hungary Family Poverty Correlation Chart
The statistical analysis conducted on geographies consisting of 248,852,848 people shows a significant positive correlation between the proportion of Japanese and poverty level among families in the United States with a correlation coefficient (R) of 0.648 and weighted average of 9.9%. Similarly, the statistical analysis conducted on geographies consisting of 195,433,579 people shows a mild positive correlation between the proportion of Immigrants from Hungary and poverty level among families in the United States with a correlation coefficient (R) of 0.380 and weighted average of 8.4%, a difference of 18.3%.
Family Poverty Correlation Summary
| Measurement | Japanese | Immigrants from Hungary |
| Minimum | 0.66% | 1.8% |
| Maximum | 45.9% | 24.5% |
| Range | 45.3% | 22.7% |
| Mean | 14.7% | 7.2% |
| Median | 11.0% | 6.4% |
| Interquartile 25% (IQ1) | 9.3% | 3.5% |
| Interquartile 75% (IQ3) | 16.8% | 8.7% |
| Interquartile Range (IQR) | 7.5% | 5.2% |
| Standard Deviation (Sample) | 9.5% | 4.9% |
| Standard Deviation (Population) | 9.4% | 4.8% |
Similar Demographics by Family Poverty
Demographics Similar to Japanese by Family Poverty
In terms of family poverty, the demographic groups most similar to Japanese are Immigrants from Cambodia (9.9%, a difference of 0.030%), Immigrants from Africa (9.9%, a difference of 0.30%), Bermudan (9.9%, a difference of 0.31%), Immigrants from Eritrea (9.9%, a difference of 0.36%), and Panamanian (9.8%, a difference of 0.49%).
| Demographics | Rating | Rank | Family Poverty |
| Immigrants | Nonimmigrants | 6.7 /100 | #215 | Tragic 9.8% |
| Moroccans | 6.5 /100 | #216 | Tragic 9.8% |
| Americans | 6.2 /100 | #217 | Tragic 9.8% |
| Panamanians | 5.6 /100 | #218 | Tragic 9.8% |
| Immigrants | Eritrea | 5.4 /100 | #219 | Tragic 9.9% |
| Bermudans | 5.3 /100 | #220 | Tragic 9.9% |
| Immigrants | Cambodia | 4.8 /100 | #221 | Tragic 9.9% |
| Japanese | 4.8 /100 | #222 | Tragic 9.9% |
| Immigrants | Africa | 4.3 /100 | #223 | Tragic 9.9% |
| Marshallese | 3.9 /100 | #224 | Tragic 9.9% |
| Immigrants | Immigrants | 3.6 /100 | #225 | Tragic 10.0% |
| Ottawa | 3.3 /100 | #226 | Tragic 10.0% |
| Immigrants | Armenia | 3.3 /100 | #227 | Tragic 10.0% |
| Sudanese | 3.1 /100 | #228 | Tragic 10.0% |
| Immigrants | Uzbekistan | 3.1 /100 | #229 | Tragic 10.0% |
Demographics Similar to Immigrants from Hungary by Family Poverty
In terms of family poverty, the demographic groups most similar to Immigrants from Hungary are Icelander (8.3%, a difference of 0.13%), Argentinean (8.4%, a difference of 0.14%), Portuguese (8.4%, a difference of 0.30%), Pakistani (8.3%, a difference of 0.33%), and Soviet Union (8.3%, a difference of 0.37%).
| Demographics | Rating | Rank | Family Poverty |
| Immigrants | Egypt | 91.6 /100 | #120 | Exceptional 8.3% |
| Native Hawaiians | 91.3 /100 | #121 | Exceptional 8.3% |
| Paraguayans | 91.2 /100 | #122 | Exceptional 8.3% |
| Palestinians | 91.1 /100 | #123 | Exceptional 8.3% |
| Soviet Union | 90.8 /100 | #124 | Exceptional 8.3% |
| Pakistanis | 90.8 /100 | #125 | Exceptional 8.3% |
| Icelanders | 90.3 /100 | #126 | Exceptional 8.3% |
| Immigrants | Hungary | 89.9 /100 | #127 | Excellent 8.4% |
| Argentineans | 89.6 /100 | #128 | Excellent 8.4% |
| Portuguese | 89.2 /100 | #129 | Excellent 8.4% |
| Immigrants | Bosnia and Herzegovina | 88.6 /100 | #130 | Excellent 8.4% |
| Puget Sound Salish | 88.6 /100 | #131 | Excellent 8.4% |
| Immigrants | Argentina | 88.2 /100 | #132 | Excellent 8.4% |
| Sri Lankans | 86.6 /100 | #133 | Excellent 8.5% |
| Chileans | 86.6 /100 | #134 | Excellent 8.5% |