Slavic vs Immigrants from Hungary Family Poverty
COMPARE
Slavic
Immigrants from Hungary
Family Poverty
Family Poverty Comparison
Slavs
Immigrants from Hungary
8.1%
FAMILY POVERTY
95.6/ 100
METRIC RATING
104th/ 347
METRIC RANK
8.4%
FAMILY POVERTY
89.9/ 100
METRIC RATING
127th/ 347
METRIC RANK
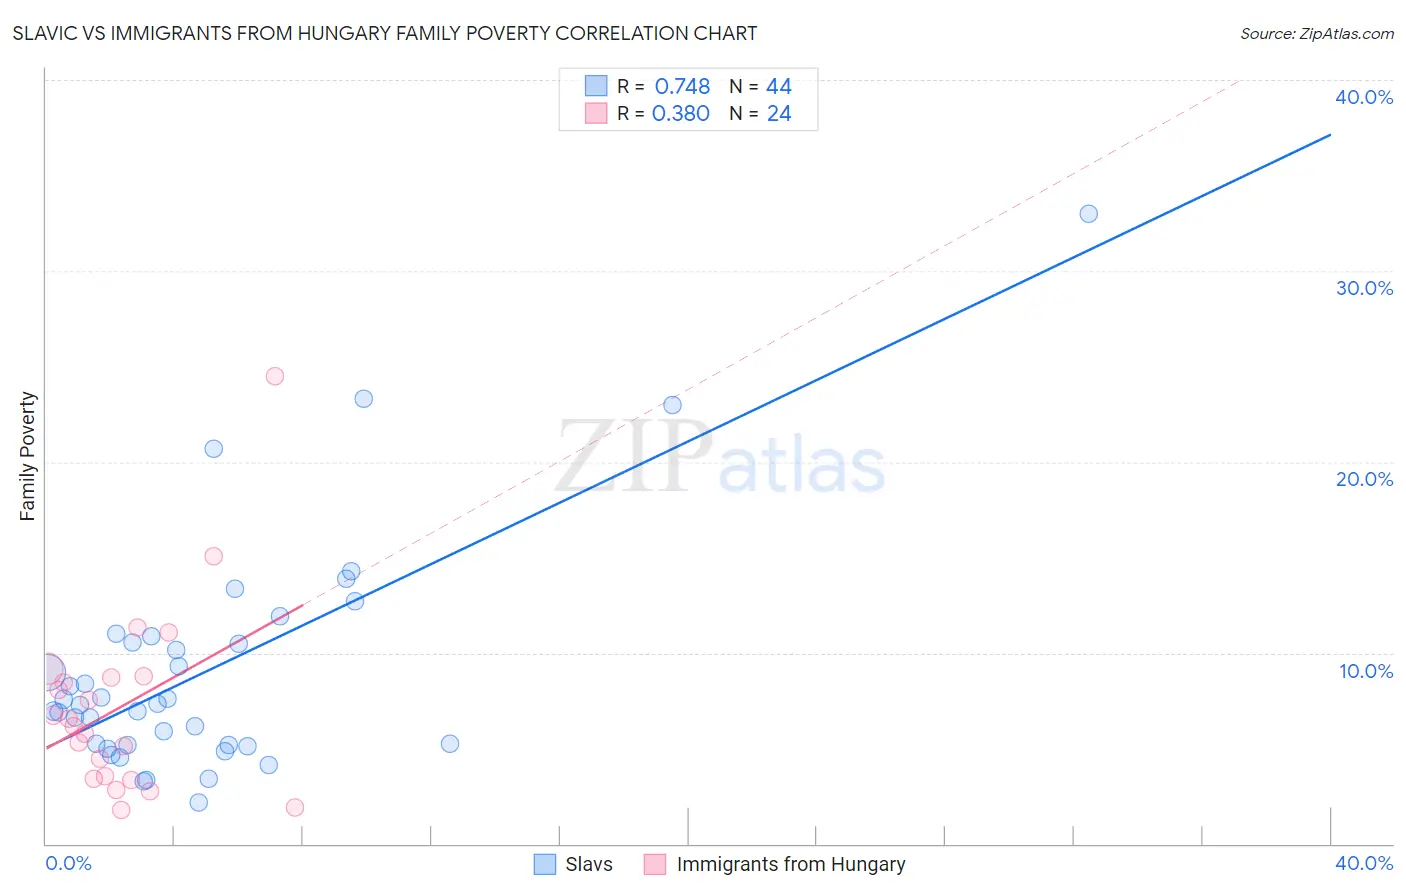
Slavic vs Immigrants from Hungary Family Poverty Correlation Chart
The statistical analysis conducted on geographies consisting of 270,374,378 people shows a strong positive correlation between the proportion of Slavs and poverty level among families in the United States with a correlation coefficient (R) of 0.748 and weighted average of 8.1%. Similarly, the statistical analysis conducted on geographies consisting of 195,433,579 people shows a mild positive correlation between the proportion of Immigrants from Hungary and poverty level among families in the United States with a correlation coefficient (R) of 0.380 and weighted average of 8.4%, a difference of 3.2%.
Family Poverty Correlation Summary
| Measurement | Slavic | Immigrants from Hungary |
| Minimum | 2.2% | 1.8% |
| Maximum | 33.0% | 24.5% |
| Range | 30.8% | 22.7% |
| Mean | 9.1% | 7.2% |
| Median | 7.3% | 6.4% |
| Interquartile 25% (IQ1) | 5.2% | 3.5% |
| Interquartile 75% (IQ3) | 10.7% | 8.7% |
| Interquartile Range (IQR) | 5.5% | 5.2% |
| Standard Deviation (Sample) | 6.1% | 4.9% |
| Standard Deviation (Population) | 6.0% | 4.8% |
Similar Demographics by Family Poverty
Demographics Similar to Slavs by Family Poverty
In terms of family poverty, the demographic groups most similar to Slavs are Immigrants from Eastern Europe (8.1%, a difference of 0.010%), Laotian (8.1%, a difference of 0.030%), Immigrants from Indonesia (8.1%, a difference of 0.10%), Immigrants from Norway (8.1%, a difference of 0.11%), and New Zealander (8.1%, a difference of 0.14%).
| Demographics | Rating | Rank | Family Poverty |
| Immigrants | Switzerland | 96.1 /100 | #97 | Exceptional 8.1% |
| Immigrants | South Africa | 95.9 /100 | #98 | Exceptional 8.1% |
| Welsh | 95.8 /100 | #99 | Exceptional 8.1% |
| New Zealanders | 95.8 /100 | #100 | Exceptional 8.1% |
| Immigrants | Norway | 95.7 /100 | #101 | Exceptional 8.1% |
| Immigrants | Indonesia | 95.7 /100 | #102 | Exceptional 8.1% |
| Immigrants | Eastern Europe | 95.6 /100 | #103 | Exceptional 8.1% |
| Slavs | 95.6 /100 | #104 | Exceptional 8.1% |
| Laotians | 95.6 /100 | #105 | Exceptional 8.1% |
| Egyptians | 95.1 /100 | #106 | Exceptional 8.1% |
| French Canadians | 95.0 /100 | #107 | Exceptional 8.1% |
| Basques | 94.9 /100 | #108 | Exceptional 8.1% |
| Jordanians | 94.8 /100 | #109 | Exceptional 8.2% |
| Romanians | 94.7 /100 | #110 | Exceptional 8.2% |
| Taiwanese | 94.6 /100 | #111 | Exceptional 8.2% |
Demographics Similar to Immigrants from Hungary by Family Poverty
In terms of family poverty, the demographic groups most similar to Immigrants from Hungary are Icelander (8.3%, a difference of 0.13%), Argentinean (8.4%, a difference of 0.14%), Portuguese (8.4%, a difference of 0.30%), Pakistani (8.3%, a difference of 0.33%), and Soviet Union (8.3%, a difference of 0.37%).
| Demographics | Rating | Rank | Family Poverty |
| Immigrants | Egypt | 91.6 /100 | #120 | Exceptional 8.3% |
| Native Hawaiians | 91.3 /100 | #121 | Exceptional 8.3% |
| Paraguayans | 91.2 /100 | #122 | Exceptional 8.3% |
| Palestinians | 91.1 /100 | #123 | Exceptional 8.3% |
| Soviet Union | 90.8 /100 | #124 | Exceptional 8.3% |
| Pakistanis | 90.8 /100 | #125 | Exceptional 8.3% |
| Icelanders | 90.3 /100 | #126 | Exceptional 8.3% |
| Immigrants | Hungary | 89.9 /100 | #127 | Excellent 8.4% |
| Argentineans | 89.6 /100 | #128 | Excellent 8.4% |
| Portuguese | 89.2 /100 | #129 | Excellent 8.4% |
| Immigrants | Bosnia and Herzegovina | 88.6 /100 | #130 | Excellent 8.4% |
| Puget Sound Salish | 88.6 /100 | #131 | Excellent 8.4% |
| Immigrants | Argentina | 88.2 /100 | #132 | Excellent 8.4% |
| Sri Lankans | 86.6 /100 | #133 | Excellent 8.5% |
| Chileans | 86.6 /100 | #134 | Excellent 8.5% |