Japanese vs Immigrants from Grenada Family Poverty
COMPARE
Japanese
Immigrants from Grenada
Family Poverty
Family Poverty Comparison
Japanese
Immigrants from Grenada
9.9%
FAMILY POVERTY
4.8/ 100
METRIC RATING
222nd/ 347
METRIC RANK
12.4%
FAMILY POVERTY
0.0/ 100
METRIC RATING
317th/ 347
METRIC RANK
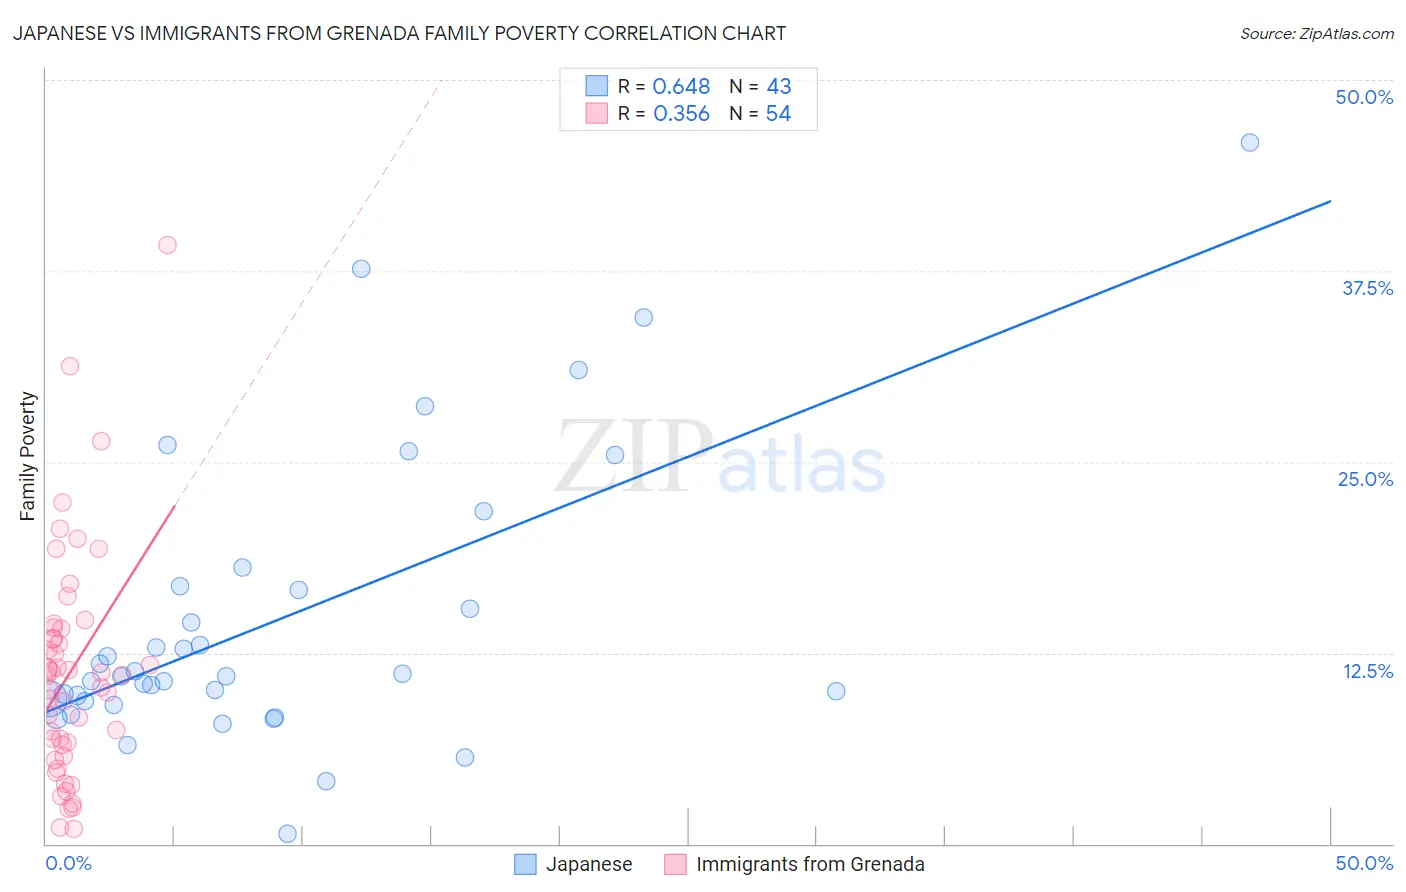
Japanese vs Immigrants from Grenada Family Poverty Correlation Chart
The statistical analysis conducted on geographies consisting of 248,852,848 people shows a significant positive correlation between the proportion of Japanese and poverty level among families in the United States with a correlation coefficient (R) of 0.648 and weighted average of 9.9%. Similarly, the statistical analysis conducted on geographies consisting of 67,148,285 people shows a mild positive correlation between the proportion of Immigrants from Grenada and poverty level among families in the United States with a correlation coefficient (R) of 0.356 and weighted average of 12.4%, a difference of 25.4%.
Family Poverty Correlation Summary
| Measurement | Japanese | Immigrants from Grenada |
| Minimum | 0.66% | 0.96% |
| Maximum | 45.9% | 39.2% |
| Range | 45.3% | 38.2% |
| Mean | 14.7% | 11.3% |
| Median | 11.0% | 11.0% |
| Interquartile 25% (IQ1) | 9.3% | 6.5% |
| Interquartile 75% (IQ3) | 16.8% | 14.1% |
| Interquartile Range (IQR) | 7.5% | 7.6% |
| Standard Deviation (Sample) | 9.5% | 7.4% |
| Standard Deviation (Population) | 9.4% | 7.3% |
Similar Demographics by Family Poverty
Demographics Similar to Japanese by Family Poverty
In terms of family poverty, the demographic groups most similar to Japanese are Immigrants from Cambodia (9.9%, a difference of 0.030%), Immigrants from Africa (9.9%, a difference of 0.30%), Bermudan (9.9%, a difference of 0.31%), Immigrants from Eritrea (9.9%, a difference of 0.36%), and Panamanian (9.8%, a difference of 0.49%).
| Demographics | Rating | Rank | Family Poverty |
| Immigrants | Nonimmigrants | 6.7 /100 | #215 | Tragic 9.8% |
| Moroccans | 6.5 /100 | #216 | Tragic 9.8% |
| Americans | 6.2 /100 | #217 | Tragic 9.8% |
| Panamanians | 5.6 /100 | #218 | Tragic 9.8% |
| Immigrants | Eritrea | 5.4 /100 | #219 | Tragic 9.9% |
| Bermudans | 5.3 /100 | #220 | Tragic 9.9% |
| Immigrants | Cambodia | 4.8 /100 | #221 | Tragic 9.9% |
| Japanese | 4.8 /100 | #222 | Tragic 9.9% |
| Immigrants | Africa | 4.3 /100 | #223 | Tragic 9.9% |
| Marshallese | 3.9 /100 | #224 | Tragic 9.9% |
| Immigrants | Immigrants | 3.6 /100 | #225 | Tragic 10.0% |
| Ottawa | 3.3 /100 | #226 | Tragic 10.0% |
| Immigrants | Armenia | 3.3 /100 | #227 | Tragic 10.0% |
| Sudanese | 3.1 /100 | #228 | Tragic 10.0% |
| Immigrants | Uzbekistan | 3.1 /100 | #229 | Tragic 10.0% |
Demographics Similar to Immigrants from Grenada by Family Poverty
In terms of family poverty, the demographic groups most similar to Immigrants from Grenada are U.S. Virgin Islander (12.4%, a difference of 0.010%), British West Indian (12.4%, a difference of 0.060%), Honduran (12.4%, a difference of 0.22%), Inupiat (12.5%, a difference of 0.54%), and Immigrants from Mexico (12.3%, a difference of 0.96%).
| Demographics | Rating | Rank | Family Poverty |
| Immigrants | Guatemala | 0.0 /100 | #310 | Tragic 12.0% |
| Ute | 0.0 /100 | #311 | Tragic 12.1% |
| Immigrants | Central America | 0.0 /100 | #312 | Tragic 12.1% |
| Immigrants | Caribbean | 0.0 /100 | #313 | Tragic 12.2% |
| Kiowa | 0.0 /100 | #314 | Tragic 12.2% |
| Immigrants | Mexico | 0.0 /100 | #315 | Tragic 12.3% |
| Hondurans | 0.0 /100 | #316 | Tragic 12.4% |
| Immigrants | Grenada | 0.0 /100 | #317 | Tragic 12.4% |
| U.S. Virgin Islanders | 0.0 /100 | #318 | Tragic 12.4% |
| British West Indians | 0.0 /100 | #319 | Tragic 12.4% |
| Inupiat | 0.0 /100 | #320 | Tragic 12.5% |
| Arapaho | 0.0 /100 | #321 | Tragic 12.7% |
| Immigrants | Honduras | 0.0 /100 | #322 | Tragic 12.7% |
| Menominee | 0.0 /100 | #323 | Tragic 12.7% |
| Immigrants | Dominica | 0.0 /100 | #324 | Tragic 12.7% |