Japanese vs Senegalese Family Poverty
COMPARE
Japanese
Senegalese
Family Poverty
Family Poverty Comparison
Japanese
Senegalese
9.9%
FAMILY POVERTY
4.8/ 100
METRIC RATING
222nd/ 347
METRIC RANK
11.5%
FAMILY POVERTY
0.0/ 100
METRIC RATING
286th/ 347
METRIC RANK
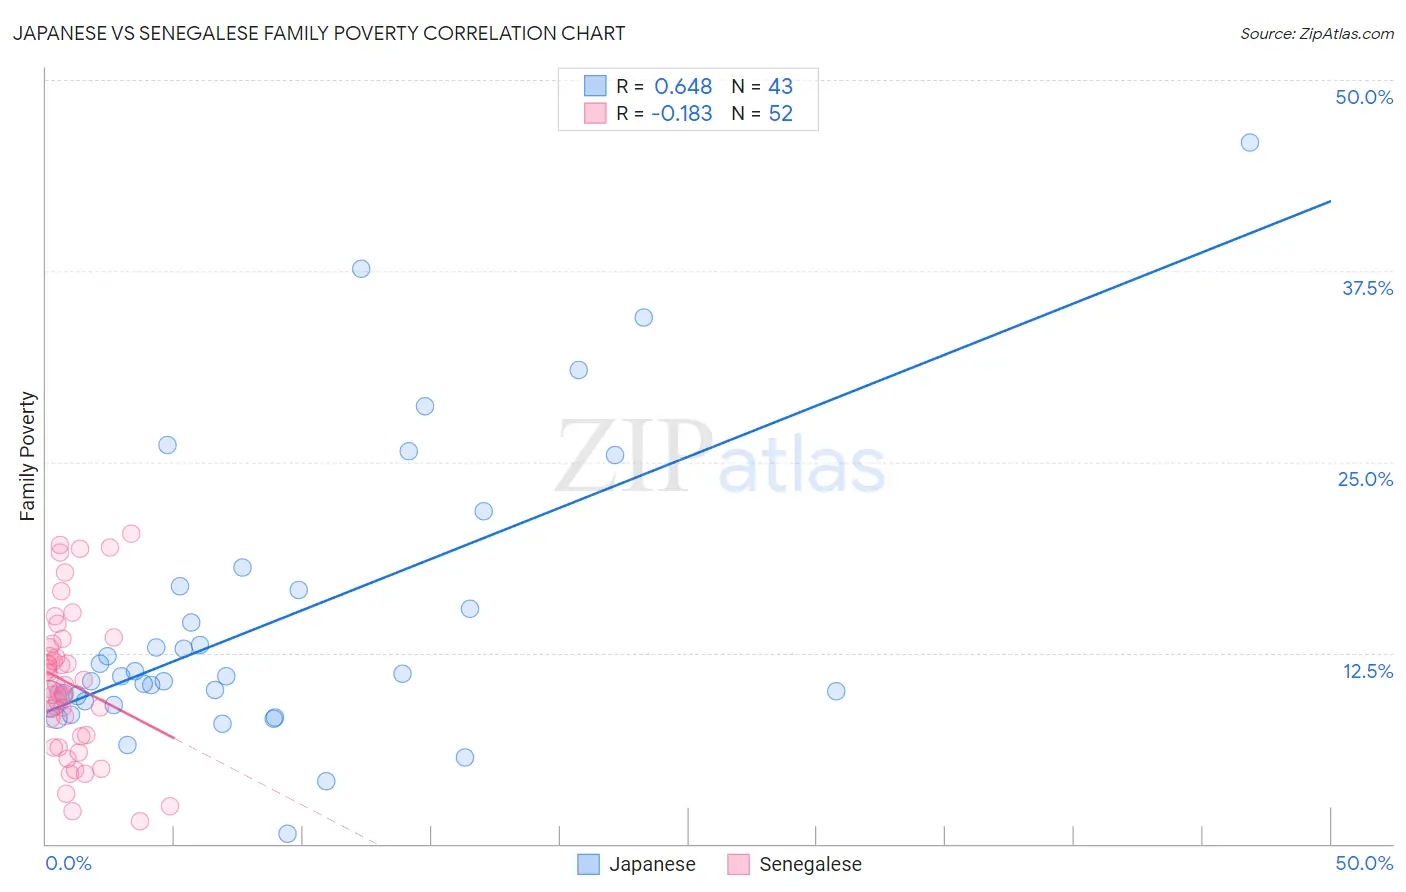
Japanese vs Senegalese Family Poverty Correlation Chart
The statistical analysis conducted on geographies consisting of 248,852,848 people shows a significant positive correlation between the proportion of Japanese and poverty level among families in the United States with a correlation coefficient (R) of 0.648 and weighted average of 9.9%. Similarly, the statistical analysis conducted on geographies consisting of 78,085,105 people shows a poor negative correlation between the proportion of Senegalese and poverty level among families in the United States with a correlation coefficient (R) of -0.183 and weighted average of 11.5%, a difference of 16.0%.
Family Poverty Correlation Summary
| Measurement | Japanese | Senegalese |
| Minimum | 0.66% | 1.5% |
| Maximum | 45.9% | 20.3% |
| Range | 45.3% | 18.9% |
| Mean | 14.7% | 10.5% |
| Median | 11.0% | 10.3% |
| Interquartile 25% (IQ1) | 9.3% | 7.1% |
| Interquartile 75% (IQ3) | 16.8% | 13.0% |
| Interquartile Range (IQR) | 7.5% | 5.9% |
| Standard Deviation (Sample) | 9.5% | 4.7% |
| Standard Deviation (Population) | 9.4% | 4.7% |
Similar Demographics by Family Poverty
Demographics Similar to Japanese by Family Poverty
In terms of family poverty, the demographic groups most similar to Japanese are Immigrants from Cambodia (9.9%, a difference of 0.030%), Immigrants from Africa (9.9%, a difference of 0.30%), Bermudan (9.9%, a difference of 0.31%), Immigrants from Eritrea (9.9%, a difference of 0.36%), and Panamanian (9.8%, a difference of 0.49%).
| Demographics | Rating | Rank | Family Poverty |
| Immigrants | Nonimmigrants | 6.7 /100 | #215 | Tragic 9.8% |
| Moroccans | 6.5 /100 | #216 | Tragic 9.8% |
| Americans | 6.2 /100 | #217 | Tragic 9.8% |
| Panamanians | 5.6 /100 | #218 | Tragic 9.8% |
| Immigrants | Eritrea | 5.4 /100 | #219 | Tragic 9.9% |
| Bermudans | 5.3 /100 | #220 | Tragic 9.9% |
| Immigrants | Cambodia | 4.8 /100 | #221 | Tragic 9.9% |
| Japanese | 4.8 /100 | #222 | Tragic 9.9% |
| Immigrants | Africa | 4.3 /100 | #223 | Tragic 9.9% |
| Marshallese | 3.9 /100 | #224 | Tragic 9.9% |
| Immigrants | Immigrants | 3.6 /100 | #225 | Tragic 10.0% |
| Ottawa | 3.3 /100 | #226 | Tragic 10.0% |
| Immigrants | Armenia | 3.3 /100 | #227 | Tragic 10.0% |
| Sudanese | 3.1 /100 | #228 | Tragic 10.0% |
| Immigrants | Uzbekistan | 3.1 /100 | #229 | Tragic 10.0% |
Demographics Similar to Senegalese by Family Poverty
In terms of family poverty, the demographic groups most similar to Senegalese are Vietnamese (11.5%, a difference of 0.27%), Immigrants from Belize (11.5%, a difference of 0.46%), Immigrants from Barbados (11.5%, a difference of 0.51%), West Indian (11.5%, a difference of 0.52%), and Haitian (11.5%, a difference of 0.58%).
| Demographics | Rating | Rank | Family Poverty |
| Blackfeet | 0.0 /100 | #279 | Tragic 11.3% |
| Belizeans | 0.0 /100 | #280 | Tragic 11.3% |
| Immigrants | West Indies | 0.0 /100 | #281 | Tragic 11.3% |
| Immigrants | Cuba | 0.0 /100 | #282 | Tragic 11.3% |
| Indonesians | 0.0 /100 | #283 | Tragic 11.3% |
| Yaqui | 0.0 /100 | #284 | Tragic 11.3% |
| Barbadians | 0.0 /100 | #285 | Tragic 11.3% |
| Senegalese | 0.0 /100 | #286 | Tragic 11.5% |
| Vietnamese | 0.0 /100 | #287 | Tragic 11.5% |
| Immigrants | Belize | 0.0 /100 | #288 | Tragic 11.5% |
| Immigrants | Barbados | 0.0 /100 | #289 | Tragic 11.5% |
| West Indians | 0.0 /100 | #290 | Tragic 11.5% |
| Haitians | 0.0 /100 | #291 | Tragic 11.5% |
| Immigrants | Somalia | 0.0 /100 | #292 | Tragic 11.5% |
| Immigrants | Cabo Verde | 0.0 /100 | #293 | Tragic 11.6% |