Japanese vs Immigrants from Colombia Family Poverty
COMPARE
Japanese
Immigrants from Colombia
Family Poverty
Family Poverty Comparison
Japanese
Immigrants from Colombia
9.9%
FAMILY POVERTY
4.8/ 100
METRIC RATING
222nd/ 347
METRIC RANK
9.3%
FAMILY POVERTY
24.4/ 100
METRIC RATING
197th/ 347
METRIC RANK
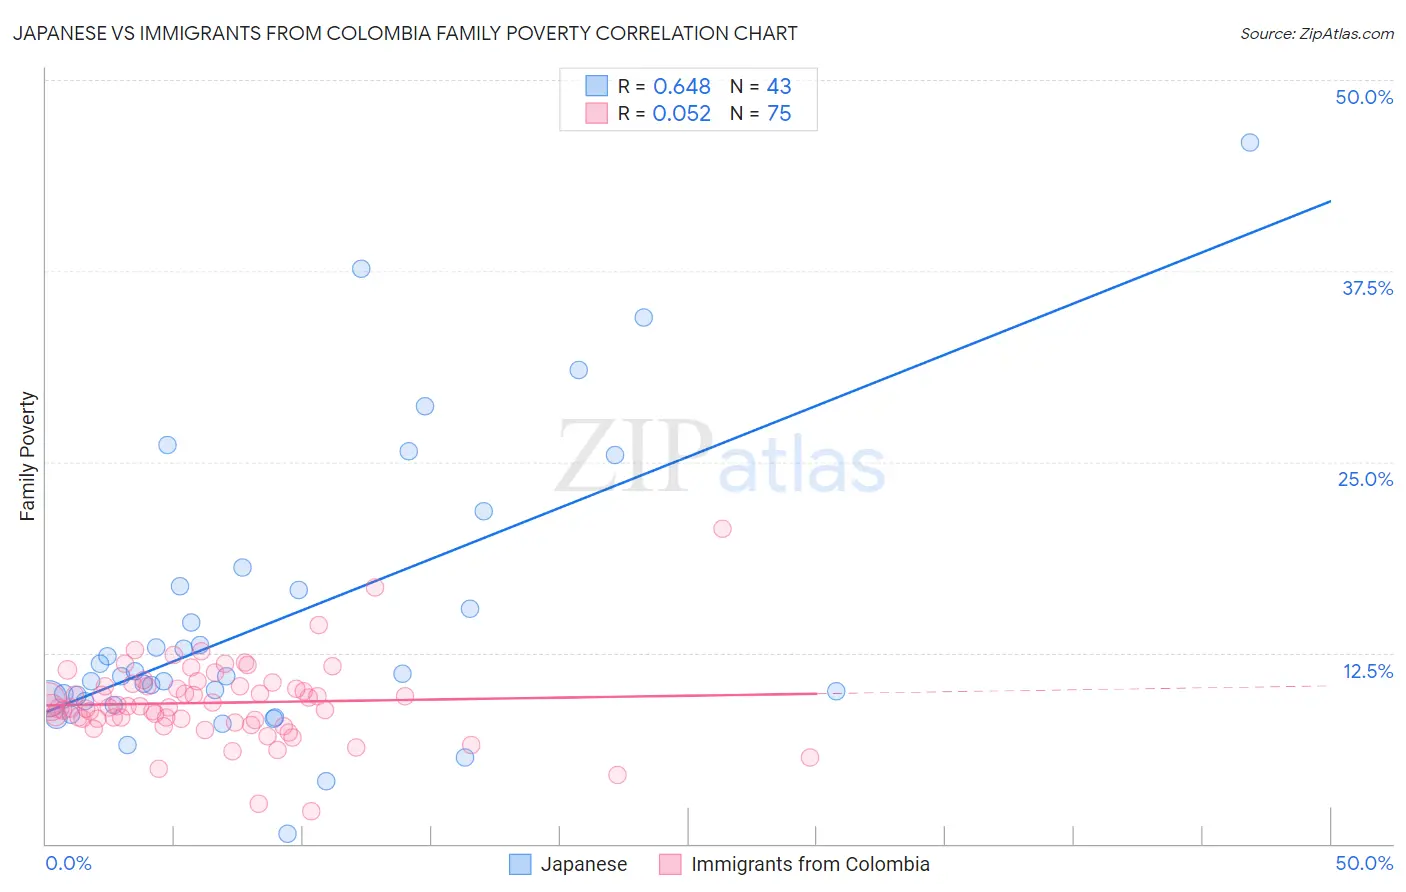
Japanese vs Immigrants from Colombia Family Poverty Correlation Chart
The statistical analysis conducted on geographies consisting of 248,852,848 people shows a significant positive correlation between the proportion of Japanese and poverty level among families in the United States with a correlation coefficient (R) of 0.648 and weighted average of 9.9%. Similarly, the statistical analysis conducted on geographies consisting of 377,791,823 people shows a slight positive correlation between the proportion of Immigrants from Colombia and poverty level among families in the United States with a correlation coefficient (R) of 0.052 and weighted average of 9.3%, a difference of 5.9%.
Family Poverty Correlation Summary
| Measurement | Japanese | Immigrants from Colombia |
| Minimum | 0.66% | 2.1% |
| Maximum | 45.9% | 20.6% |
| Range | 45.3% | 18.5% |
| Mean | 14.7% | 9.2% |
| Median | 11.0% | 8.9% |
| Interquartile 25% (IQ1) | 9.3% | 8.1% |
| Interquartile 75% (IQ3) | 16.8% | 10.3% |
| Interquartile Range (IQR) | 7.5% | 2.3% |
| Standard Deviation (Sample) | 9.5% | 2.7% |
| Standard Deviation (Population) | 9.4% | 2.7% |
Similar Demographics by Family Poverty
Demographics Similar to Japanese by Family Poverty
In terms of family poverty, the demographic groups most similar to Japanese are Immigrants from Cambodia (9.9%, a difference of 0.030%), Immigrants from Africa (9.9%, a difference of 0.30%), Bermudan (9.9%, a difference of 0.31%), Immigrants from Eritrea (9.9%, a difference of 0.36%), and Panamanian (9.8%, a difference of 0.49%).
| Demographics | Rating | Rank | Family Poverty |
| Immigrants | Nonimmigrants | 6.7 /100 | #215 | Tragic 9.8% |
| Moroccans | 6.5 /100 | #216 | Tragic 9.8% |
| Americans | 6.2 /100 | #217 | Tragic 9.8% |
| Panamanians | 5.6 /100 | #218 | Tragic 9.8% |
| Immigrants | Eritrea | 5.4 /100 | #219 | Tragic 9.9% |
| Bermudans | 5.3 /100 | #220 | Tragic 9.9% |
| Immigrants | Cambodia | 4.8 /100 | #221 | Tragic 9.9% |
| Japanese | 4.8 /100 | #222 | Tragic 9.9% |
| Immigrants | Africa | 4.3 /100 | #223 | Tragic 9.9% |
| Marshallese | 3.9 /100 | #224 | Tragic 9.9% |
| Immigrants | Immigrants | 3.6 /100 | #225 | Tragic 10.0% |
| Ottawa | 3.3 /100 | #226 | Tragic 10.0% |
| Immigrants | Armenia | 3.3 /100 | #227 | Tragic 10.0% |
| Sudanese | 3.1 /100 | #228 | Tragic 10.0% |
| Immigrants | Uzbekistan | 3.1 /100 | #229 | Tragic 10.0% |
Demographics Similar to Immigrants from Colombia by Family Poverty
In terms of family poverty, the demographic groups most similar to Immigrants from Colombia are Iraqi (9.3%, a difference of 0.030%), Spaniard (9.4%, a difference of 0.28%), Immigrants from Venezuela (9.3%, a difference of 0.29%), Immigrants from Costa Rica (9.4%, a difference of 0.47%), and Venezuelan (9.3%, a difference of 0.50%).
| Demographics | Rating | Rank | Family Poverty |
| Arabs | 31.5 /100 | #190 | Fair 9.2% |
| Ugandans | 28.7 /100 | #191 | Fair 9.3% |
| Spanish | 28.7 /100 | #192 | Fair 9.3% |
| Immigrants | Western Asia | 28.2 /100 | #193 | Fair 9.3% |
| South Americans | 28.1 /100 | #194 | Fair 9.3% |
| Venezuelans | 27.4 /100 | #195 | Fair 9.3% |
| Immigrants | Venezuela | 26.1 /100 | #196 | Fair 9.3% |
| Immigrants | Colombia | 24.4 /100 | #197 | Fair 9.3% |
| Iraqis | 24.2 /100 | #198 | Fair 9.3% |
| Spaniards | 22.8 /100 | #199 | Fair 9.4% |
| Immigrants | Costa Rica | 21.7 /100 | #200 | Fair 9.4% |
| Immigrants | Portugal | 20.5 /100 | #201 | Fair 9.4% |
| Immigrants | Sierra Leone | 19.6 /100 | #202 | Poor 9.4% |
| German Russians | 19.4 /100 | #203 | Poor 9.4% |
| Immigrants | Lebanon | 18.9 /100 | #204 | Poor 9.4% |