Immigrants from Congo vs Immigrants from Hungary Family Poverty

COMPARE

Immigrants from Congo
Race
Ancestry
AfghanAfricanAlaska NativeAlaskan AthabascanAlbanianAleutAlsatianAmericanApacheArabArapahoArgentineanArmenianAssyrian/Chaldean/SyriacAustralianAustrianBahamianBangladeshiBarbadianBasqueBelgianBelizeanBermudanBhutaneseBlackfeetBolivianBrazilianBritishBritish West IndianBulgarianBurmeseCajunCambodianCanadianCape VerdeanCarpatho RusynCelticCentral AmericanCentral American IndianCherokeeCheyenneChickasawChileanChineseChippewaChoctawColombianColvilleComancheCosta RicanCreeCreekCroatianCrowCubanCypriotCzechCzechoslovakianDanishDelawareDominicanDutchDutch West IndianEastern EuropeanEcuadorianEgyptianEnglishEstonianEthiopianEuropeanFijianFilipinoFinnishFrenchFrench American IndianFrench CanadianGermanGerman RussianGhanaianGreekGuamanian/ChamorroGuatemalanGuyaneseHaitianHmongHonduranHopiHoumaHungarianIcelanderIndian (Asian)IndonesianInupiatIranianIraqiIrishIroquoisIsraeliItalianJamaicanJapaneseJordanianKenyanKiowaKoreanLaotianLatvianLebaneseLiberianLithuanianLumbeeLuxembourgerMacedonianMalaysianMalteseMarshalleseMenomineeMexicanMexican American IndianMongolianMoroccanNative HawaiianNavajoNepaleseNew ZealanderNicaraguanNigerianNorthern EuropeanNorwegianOkinawanOsageOttawaPaiutePakistaniPalestinianPanamanianParaguayanPennsylvania GermanPeruvianPimaPolishPortuguesePotawatomiPuebloPuerto RicanPuget Sound SalishRomanianRussianSalvadoranSamoanScandinavianScotch-IrishScottishSeminoleSenegaleseSerbianShoshoneSierra LeoneanSiouxSlavicSlovakSloveneSomaliSouth AfricanSouth AmericanSouth American IndianSoviet UnionSpaniardSpanishSpanish AmericanSpanish American IndianSri LankanSubsaharan AfricanSudaneseSwedishSwissSyrianTaiwaneseThaiTlingit-HaidaTohono O'OdhamTonganTrinidadian and TobagonianTsimshianTurkishU.S. Virgin IslanderUgandanUkrainianUruguayanUteVenezuelanVietnameseWelshWest IndianYakamaYaquiYugoslavianYumanYup'ikZimbabwean
Immigration
NonimmigrantsImmigrantsAfghanistanAfricaAlbaniaArgentinaArmeniaAsiaAustraliaAustriaBahamasBangladeshBarbadosBelarusBelgiumBelizeBoliviaBosnia and HerzegovinaBrazilBulgariaBurma/MyanmarCabo VerdeCambodiaCameroonCanadaCaribbeanCentral AmericaChileChinaColombiaCongoCosta RicaCroatiaCubaCzechoslovakiaDenmarkDominicaDominican RepublicEastern AfricaEastern AsiaEastern EuropeEcuadorEgyptEl SalvadorEnglandEritreaEthiopiaEuropeFijiFranceGermanyGhanaGreeceGrenadaGuatemalaGuyanaHaitiHondurasHong KongIndiaIndonesiaIranIraqIrelandIsraelItalyJamaicaJapanJordanKazakhstanKenyaKoreaKuwaitLaosLatin AmericaLatviaLebanonLiberiaLithuaniaMalaysiaMexicoMicronesiaMiddle AfricaMoldovaMoroccoNepalNetherlandsNicaraguaNigeriaNorth AmericaNorth MacedoniaNorthern AfricaNorthern EuropeNorwayOceaniaPakistanPanamaPeruPhilippinesPolandPortugalRomaniaRussiaSaudi ArabiaScotlandSenegalSerbiaSierra LeoneSingaporeSomaliaSouth AfricaSouth AmericaSouth Central AsiaSouth Eastern AsiaSouthern EuropeSpainSri LankaSt. Vincent and the GrenadinesSudanSwedenSwitzerlandSyriaTaiwanThailandTrinidad and TobagoTurkeyUgandaUkraineUruguayUzbekistanVenezuelaVietnamWest IndiesWestern AfricaWestern AsiaWestern EuropeYemenZaireZimbabweAzores
Immigrants from Hungary
Race
Ancestry
AfghanAfricanAlaska NativeAlaskan AthabascanAlbanianAleutAlsatianAmericanApacheArabArapahoArgentineanArmenianAssyrian/Chaldean/SyriacAustralianAustrianBahamianBangladeshiBarbadianBasqueBelgianBelizeanBermudanBhutaneseBlackfeetBolivianBrazilianBritishBritish West IndianBulgarianBurmeseCajunCambodianCanadianCape VerdeanCarpatho RusynCelticCentral AmericanCentral American IndianCherokeeCheyenneChickasawChileanChineseChippewaChoctawColombianColvilleComancheCosta RicanCreeCreekCroatianCrowCubanCypriotCzechCzechoslovakianDanishDelawareDominicanDutchDutch West IndianEastern EuropeanEcuadorianEgyptianEnglishEstonianEthiopianEuropeanFijianFilipinoFinnishFrenchFrench American IndianFrench CanadianGermanGerman RussianGhanaianGreekGuamanian/ChamorroGuatemalanGuyaneseHaitianHmongHonduranHopiHoumaHungarianIcelanderIndian (Asian)IndonesianInupiatIranianIraqiIrishIroquoisIsraeliItalianJamaicanJapaneseJordanianKenyanKiowaKoreanLaotianLatvianLebaneseLiberianLithuanianLumbeeLuxembourgerMacedonianMalaysianMalteseMarshalleseMenomineeMexicanMexican American IndianMongolianMoroccanNative HawaiianNavajoNepaleseNew ZealanderNicaraguanNigerianNorthern EuropeanNorwegianOkinawanOsageOttawaPaiutePakistaniPalestinianPanamanianParaguayanPennsylvania GermanPeruvianPimaPolishPortuguesePotawatomiPuebloPuerto RicanPuget Sound SalishRomanianRussianSalvadoranSamoanScandinavianScotch-IrishScottishSeminoleSenegaleseSerbianShoshoneSierra LeoneanSiouxSlavicSlovakSloveneSomaliSouth AfricanSouth AmericanSouth American IndianSoviet UnionSpaniardSpanishSpanish AmericanSpanish American IndianSri LankanSubsaharan AfricanSudaneseSwedishSwissSyrianTaiwaneseThaiTlingit-HaidaTohono O'OdhamTonganTrinidadian and TobagonianTsimshianTurkishU.S. Virgin IslanderUgandanUkrainianUruguayanUteVenezuelanVietnameseWelshWest IndianYakamaYaquiYugoslavianYumanYup'ikZimbabwean
Immigration
NonimmigrantsImmigrantsAfghanistanAfricaAlbaniaArgentinaArmeniaAsiaAustraliaAustriaBahamasBangladeshBarbadosBelarusBelgiumBelizeBoliviaBosnia and HerzegovinaBrazilBulgariaBurma/MyanmarCabo VerdeCambodiaCameroonCanadaCaribbeanCentral AmericaChileChinaColombiaCosta RicaCroatiaCubaCzechoslovakiaDenmarkDominicaDominican RepublicEastern AfricaEastern AsiaEastern EuropeEcuadorEgyptEl SalvadorEnglandEritreaEthiopiaEuropeFijiFranceGermanyGhanaGreeceGrenadaGuatemalaGuyanaHaitiHondurasHong KongHungaryIndiaIndonesiaIranIraqIrelandIsraelItalyJamaicaJapanJordanKazakhstanKenyaKoreaKuwaitLaosLatin AmericaLatviaLebanonLiberiaLithuaniaMalaysiaMexicoMicronesiaMiddle AfricaMoldovaMoroccoNepalNetherlandsNicaraguaNigeriaNorth AmericaNorth MacedoniaNorthern AfricaNorthern EuropeNorwayOceaniaPakistanPanamaPeruPhilippinesPolandPortugalRomaniaRussiaSaudi ArabiaScotlandSenegalSerbiaSierra LeoneSingaporeSomaliaSouth AfricaSouth AmericaSouth Central AsiaSouth Eastern AsiaSouthern EuropeSpainSri LankaSt. Vincent and the GrenadinesSudanSwedenSwitzerlandSyriaTaiwanThailandTrinidad and TobagoTurkeyUgandaUkraineUruguayUzbekistanVenezuelaVietnamWest IndiesWestern AfricaWestern AsiaWestern EuropeYemenZaireZimbabweAzores
Family Poverty
Income
Poverty
Unemployment
Labor Participation
Family Structure
Vehicle Availability
Education Level
Disability

Family Poverty Comparison

Immigrants from Congo

Immigrants from Hungary

Tragic
Excellent
11.9%
FAMILY POVERTY
0.0/ 100
METRIC RATING
307th/ 347
METRIC RANK
8.4%
FAMILY POVERTY
89.9/ 100
METRIC RATING
127th/ 347
METRIC RANK

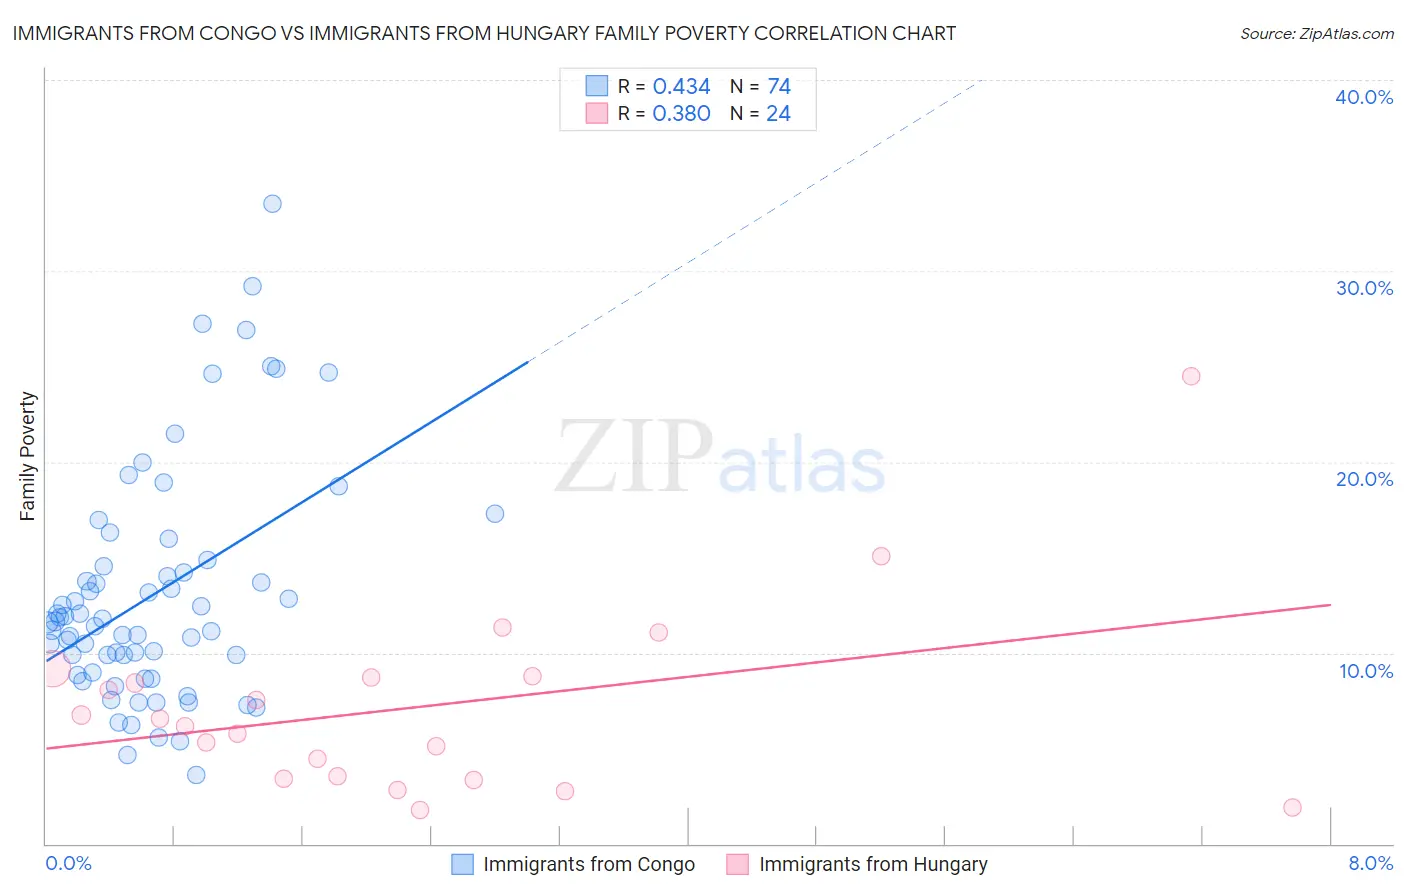
Immigrants from Congo vs Immigrants from Hungary Family Poverty Correlation Chart

The statistical analysis conducted on geographies consisting of 92,062,434 people shows a moderate positive correlation between the proportion of Immigrants from Congo and poverty level among families in the United States with a correlation coefficient (R) of 0.434 and weighted average of 11.9%. Similarly, the statistical analysis conducted on geographies consisting of 195,433,579 people shows a mild positive correlation between the proportion of Immigrants from Hungary and poverty level among families in the United States with a correlation coefficient (R) of 0.380 and weighted average of 8.4%, a difference of 42.3%.
Immigrants from Congo vs Immigrants from Hungary Family Poverty

Family Poverty Correlation Summary

MeasurementImmigrants from CongoImmigrants from Hungary
Minimum3.6%1.8%
Maximum33.5%24.5%
Range29.9%22.7%
Mean13.1%7.2%
Median11.6%6.4%
Interquartile 25% (IQ1)9.0%3.5%
Interquartile 75% (IQ3)14.5%8.7%
Interquartile Range (IQR)5.5%5.2%
Standard Deviation (Sample)6.1%4.9%
Standard Deviation (Population)6.1%4.8%

Similar Demographics by Family Poverty

Demographics Similar to Immigrants from Congo by Family Poverty

In terms of family poverty, the demographic groups most similar to Immigrants from Congo are Seminole (11.9%, a difference of 0.060%), Cajun (11.9%, a difference of 0.11%), Hispanic or Latino (12.0%, a difference of 0.50%), Immigrants from Guatemala (12.0%, a difference of 0.51%), and Mexican (11.8%, a difference of 0.67%).
DemographicsRating | RankFamily Poverty
Immigrants | Bangladesh
0.0
/100
|
#300
Tragic
11.7%
Bahamians
0.0
/100
|
#301
Tragic
11.7%
Guatemalans
0.0
/100
|
#302
Tragic
11.7%
Africans
0.0
/100
|
#303
Tragic
11.8%
Immigrants | Latin America
0.0
/100
|
#304
Tragic
11.8%
Mexicans
0.0
/100
|
#305
Tragic
11.8%
Cajuns
0.0
/100
|
#306
Tragic
11.9%
Immigrants | Congo
0.0
/100
|
#307
Tragic
11.9%
Seminole
0.0
/100
|
#308
Tragic
11.9%
Hispanics or Latinos
0.0
/100
|
#309
Tragic
12.0%
Immigrants | Guatemala
0.0
/100
|
#310
Tragic
12.0%
Ute
0.0
/100
|
#311
Tragic
12.1%
Immigrants | Central America
0.0
/100
|
#312
Tragic
12.1%
Immigrants | Caribbean
0.0
/100
|
#313
Tragic
12.2%
Kiowa
0.0
/100
|
#314
Tragic
12.2%

Demographics Similar to Immigrants from Hungary by Family Poverty

In terms of family poverty, the demographic groups most similar to Immigrants from Hungary are Icelander (8.3%, a difference of 0.13%), Argentinean (8.4%, a difference of 0.14%), Portuguese (8.4%, a difference of 0.30%), Pakistani (8.3%, a difference of 0.33%), and Soviet Union (8.3%, a difference of 0.37%).
DemographicsRating | RankFamily Poverty
Immigrants | Egypt
91.6
/100
|
#120
Exceptional
8.3%
Native Hawaiians
91.3
/100
|
#121
Exceptional
8.3%
Paraguayans
91.2
/100
|
#122
Exceptional
8.3%
Palestinians
91.1
/100
|
#123
Exceptional
8.3%
Soviet Union
90.8
/100
|
#124
Exceptional
8.3%
Pakistanis
90.8
/100
|
#125
Exceptional
8.3%
Icelanders
90.3
/100
|
#126
Exceptional
8.3%
Immigrants | Hungary
89.9
/100
|
#127
Excellent
8.4%
Argentineans
89.6
/100
|
#128
Excellent
8.4%
Portuguese
89.2
/100
|
#129
Excellent
8.4%
Immigrants | Bosnia and Herzegovina
88.6
/100
|
#130
Excellent
8.4%
Puget Sound Salish
88.6
/100
|
#131
Excellent
8.4%
Immigrants | Argentina
88.2
/100
|
#132
Excellent
8.4%
Sri Lankans
86.6
/100
|
#133
Excellent
8.5%
Chileans
86.6
/100
|
#134
Excellent
8.5%