Immigrants vs Cuban Single Female Poverty

COMPARE

Immigrants
Race
Ancestry
AfghanAfricanAlaska NativeAlaskan AthabascanAlbanianAleutAlsatianAmericanApacheArabArapahoArgentineanArmenianAssyrian/Chaldean/SyriacAustralianAustrianBahamianBangladeshiBarbadianBasqueBelgianBelizeanBermudanBhutaneseBlackfeetBolivianBrazilianBritishBritish West IndianBulgarianBurmeseCajunCambodianCanadianCape VerdeanCarpatho RusynCelticCentral AmericanCentral American IndianCherokeeCheyenneChickasawChileanChineseChippewaChoctawColombianColvilleComancheCosta RicanCreeCreekCroatianCrowCypriotCzechCzechoslovakianDanishDelawareDominicanDutchDutch West IndianEastern EuropeanEcuadorianEgyptianEnglishEstonianEthiopianEuropeanFijianFilipinoFinnishFrenchFrench American IndianFrench CanadianGermanGerman RussianGhanaianGreekGuamanian/ChamorroGuatemalanGuyaneseHaitianHmongHonduranHopiHoumaHungarianIcelanderIndian (Asian)IndonesianInupiatIranianIraqiIrishIroquoisIsraeliItalianJamaicanJapaneseJordanianKenyanKiowaKoreanLaotianLatvianLebaneseLiberianLithuanianLumbeeLuxembourgerMacedonianMalaysianMalteseMarshalleseMenomineeMexicanMexican American IndianMongolianMoroccanNative HawaiianNavajoNepaleseNew ZealanderNicaraguanNigerianNorthern EuropeanNorwegianOkinawanOsageOttawaPaiutePakistaniPalestinianPanamanianParaguayanPennsylvania GermanPeruvianPimaPolishPortuguesePotawatomiPuebloPuerto RicanPuget Sound SalishRomanianRussianSalvadoranSamoanScandinavianScotch-IrishScottishSeminoleSenegaleseSerbianShoshoneSierra LeoneanSiouxSlavicSlovakSloveneSomaliSouth AfricanSouth AmericanSouth American IndianSoviet UnionSpaniardSpanishSpanish AmericanSpanish American IndianSri LankanSubsaharan AfricanSudaneseSwedishSwissSyrianTaiwaneseThaiTlingit-HaidaTohono O'OdhamTonganTrinidadian and TobagonianTsimshianTurkishU.S. Virgin IslanderUgandanUkrainianUruguayanUteVenezuelanVietnameseWelshWest IndianYakamaYaquiYugoslavianYumanYup'ikZimbabwean
Immigration
NonimmigrantsImmigrantsAfghanistanAfricaAlbaniaArgentinaArmeniaAsiaAustraliaAustriaBahamasBangladeshBarbadosBelarusBelgiumBelizeBoliviaBosnia and HerzegovinaBrazilBulgariaBurma/MyanmarCabo VerdeCambodiaCameroonCanadaCaribbeanCentral AmericaChileChinaColombiaCongoCosta RicaCroatiaCubaCzechoslovakiaDenmarkDominicaDominican RepublicEastern AfricaEastern AsiaEastern EuropeEcuadorEgyptEl SalvadorEnglandEritreaEthiopiaEuropeFijiFranceGermanyGhanaGreeceGrenadaGuatemalaGuyanaHaitiHondurasHong KongHungaryIndiaIndonesiaIranIraqIrelandIsraelItalyJamaicaJapanJordanKazakhstanKenyaKoreaKuwaitLaosLatin AmericaLatviaLebanonLiberiaLithuaniaMalaysiaMexicoMicronesiaMiddle AfricaMoldovaMoroccoNepalNetherlandsNicaraguaNigeriaNorth AmericaNorth MacedoniaNorthern AfricaNorthern EuropeNorwayOceaniaPakistanPanamaPeruPhilippinesPolandPortugalRomaniaRussiaSaudi ArabiaScotlandSenegalSerbiaSierra LeoneSingaporeSomaliaSouth AfricaSouth AmericaSouth Central AsiaSouth Eastern AsiaSouthern EuropeSpainSri LankaSt. Vincent and the GrenadinesSudanSwedenSwitzerlandSyriaTaiwanThailandTrinidad and TobagoTurkeyUgandaUkraineUruguayUzbekistanVenezuelaVietnamWest IndiesWestern AfricaWestern AsiaWestern EuropeYemenZaireZimbabweAzores
Cuban
Race
Ancestry
AfghanAfricanAlaska NativeAlaskan AthabascanAlbanianAleutAlsatianAmericanApacheArabArapahoArgentineanArmenianAssyrian/Chaldean/SyriacAustralianAustrianBahamianBangladeshiBarbadianBasqueBelgianBelizeanBermudanBhutaneseBlackfeetBolivianBrazilianBritishBritish West IndianBulgarianBurmeseCajunCambodianCanadianCape VerdeanCarpatho RusynCelticCentral AmericanCentral American IndianCherokeeCheyenneChickasawChileanChineseChippewaChoctawColombianColvilleComancheCosta RicanCreeCreekCroatianCrowCubanCypriotCzechCzechoslovakianDanishDelawareDominicanDutchDutch West IndianEastern EuropeanEcuadorianEgyptianEnglishEstonianEthiopianEuropeanFijianFilipinoFinnishFrenchFrench American IndianFrench CanadianGermanGerman RussianGhanaianGreekGuamanian/ChamorroGuatemalanGuyaneseHaitianHmongHonduranHopiHoumaHungarianIcelanderIndian (Asian)IndonesianInupiatIranianIraqiIrishIroquoisIsraeliItalianJamaicanJapaneseJordanianKenyanKiowaKoreanLaotianLatvianLebaneseLiberianLithuanianLumbeeLuxembourgerMacedonianMalaysianMalteseMarshalleseMenomineeMexicanMexican American IndianMongolianMoroccanNative HawaiianNavajoNepaleseNew ZealanderNicaraguanNigerianNorthern EuropeanNorwegianOkinawanOsageOttawaPaiutePakistaniPalestinianPanamanianParaguayanPennsylvania GermanPeruvianPimaPolishPortuguesePotawatomiPuebloPuerto RicanPuget Sound SalishRomanianRussianSalvadoranSamoanScandinavianScotch-IrishScottishSeminoleSenegaleseSerbianShoshoneSierra LeoneanSiouxSlavicSlovakSloveneSomaliSouth AfricanSouth AmericanSouth American IndianSoviet UnionSpaniardSpanishSpanish AmericanSpanish American IndianSri LankanSubsaharan AfricanSudaneseSwedishSwissSyrianTaiwaneseThaiTlingit-HaidaTohono O'OdhamTonganTrinidadian and TobagonianTsimshianTurkishU.S. Virgin IslanderUgandanUkrainianUruguayanUteVenezuelanVietnameseWelshWest IndianYakamaYaquiYugoslavianYumanYup'ikZimbabwean
Immigration
NonimmigrantsAfghanistanAfricaAlbaniaArgentinaArmeniaAsiaAustraliaAustriaBahamasBangladeshBarbadosBelarusBelgiumBelizeBoliviaBosnia and HerzegovinaBrazilBulgariaBurma/MyanmarCabo VerdeCambodiaCameroonCanadaCaribbeanCentral AmericaChileChinaColombiaCongoCosta RicaCroatiaCubaCzechoslovakiaDenmarkDominicaDominican RepublicEastern AfricaEastern AsiaEastern EuropeEcuadorEgyptEl SalvadorEnglandEritreaEthiopiaEuropeFijiFranceGermanyGhanaGreeceGrenadaGuatemalaGuyanaHaitiHondurasHong KongHungaryIndiaIndonesiaIranIraqIrelandIsraelItalyJamaicaJapanJordanKazakhstanKenyaKoreaKuwaitLaosLatin AmericaLatviaLebanonLiberiaLithuaniaMalaysiaMexicoMicronesiaMiddle AfricaMoldovaMoroccoNepalNetherlandsNicaraguaNigeriaNorth AmericaNorth MacedoniaNorthern AfricaNorthern EuropeNorwayOceaniaPakistanPanamaPeruPhilippinesPolandPortugalRomaniaRussiaSaudi ArabiaScotlandSenegalSerbiaSierra LeoneSingaporeSomaliaSouth AfricaSouth AmericaSouth Central AsiaSouth Eastern AsiaSouthern EuropeSpainSri LankaSt. Vincent and the GrenadinesSudanSwedenSwitzerlandSyriaTaiwanThailandTrinidad and TobagoTurkeyUgandaUkraineUruguayUzbekistanVenezuelaVietnamWest IndiesWestern AfricaWestern AsiaWestern EuropeYemenZaireZimbabweAzores
Single Female Poverty
Income
Poverty
Unemployment
Labor Participation
Family Structure
Vehicle Availability
Education Level
Disability

Single Female Poverty Comparison

Immigrants

Cubans

Fair
Average
21.4%
SINGLE FEMALE POVERTY
22.0/ 100
METRIC RATING
199th/ 347
METRIC RANK
21.0%
SINGLE FEMALE POVERTY
50.0/ 100
METRIC RATING
174th/ 347
METRIC RANK

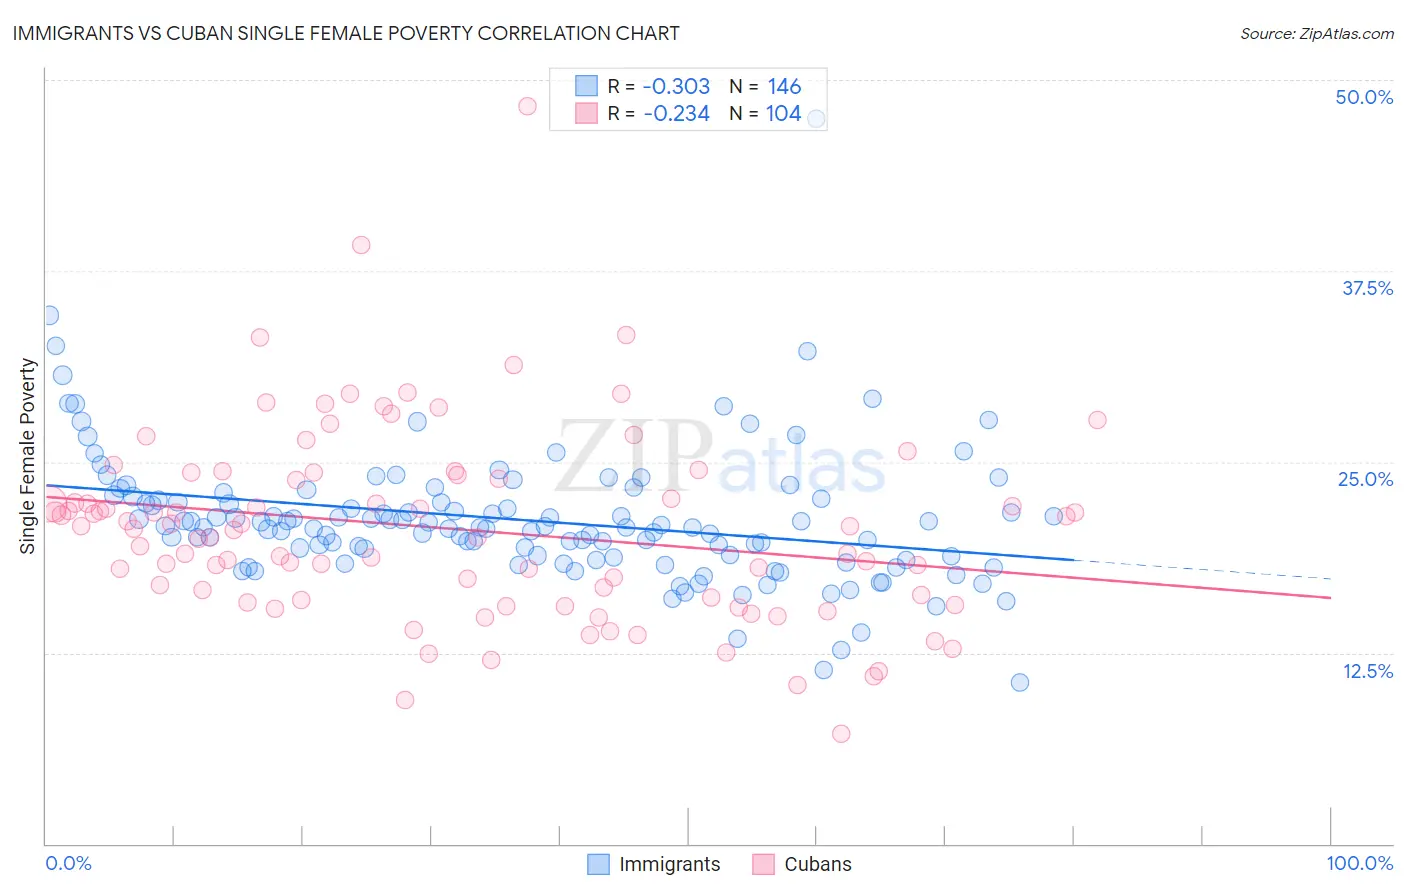
Immigrants vs Cuban Single Female Poverty Correlation Chart

The statistical analysis conducted on geographies consisting of 556,808,964 people shows a mild negative correlation between the proportion of Immigrants and poverty level among single females in the United States with a correlation coefficient (R) of -0.303 and weighted average of 21.4%. Similarly, the statistical analysis conducted on geographies consisting of 441,584,431 people shows a weak negative correlation between the proportion of Cubans and poverty level among single females in the United States with a correlation coefficient (R) of -0.234 and weighted average of 21.0%, a difference of 2.0%.
Immigrants vs Cuban Single Female Poverty

Single Female Poverty Correlation Summary

MeasurementImmigrantsCuban
Minimum10.5%7.2%
Maximum47.5%48.3%
Range36.9%41.1%
Mean21.2%20.6%
Median20.7%20.6%
Interquartile 25% (IQ1)18.9%16.0%
Interquartile 75% (IQ3)22.6%24.0%
Interquartile Range (IQR)3.8%8.0%
Standard Deviation (Sample)4.4%6.3%
Standard Deviation (Population)4.4%6.3%

Similar Demographics by Single Female Poverty

Demographics Similar to Immigrants by Single Female Poverty

In terms of single female poverty, the demographic groups most similar to Immigrants are Irish (21.4%, a difference of 0.050%), Nigerian (21.4%, a difference of 0.10%), Immigrants from Kenya (21.4%, a difference of 0.12%), Swiss (21.4%, a difference of 0.19%), and Immigrants from Haiti (21.5%, a difference of 0.30%).
DemographicsRating | RankSingle Female Poverty
Immigrants | Jamaica
30.5
/100
|
#192
Fair
21.3%
Basques
28.1
/100
|
#193
Fair
21.3%
Czechoslovakians
27.7
/100
|
#194
Fair
21.3%
Nicaraguans
27.6
/100
|
#195
Fair
21.3%
Immigrants | Saudi Arabia
27.1
/100
|
#196
Fair
21.3%
Japanese
26.4
/100
|
#197
Fair
21.3%
Swiss
24.2
/100
|
#198
Fair
21.4%
Immigrants | Immigrants
22.0
/100
|
#199
Fair
21.4%
Irish
21.4
/100
|
#200
Fair
21.4%
Nigerians
20.9
/100
|
#201
Fair
21.4%
Immigrants | Kenya
20.7
/100
|
#202
Fair
21.4%
Immigrants | Haiti
18.8
/100
|
#203
Poor
21.5%
Immigrants | Africa
16.7
/100
|
#204
Poor
21.5%
Finns
16.2
/100
|
#205
Poor
21.5%
Belgians
16.1
/100
|
#206
Poor
21.5%

Demographics Similar to Cubans by Single Female Poverty

In terms of single female poverty, the demographic groups most similar to Cubans are Immigrants from Guyana (21.0%, a difference of 0.040%), Guyanese (21.0%, a difference of 0.13%), Moroccan (21.0%, a difference of 0.17%), New Zealander (21.0%, a difference of 0.20%), and Czech (21.0%, a difference of 0.20%).
DemographicsRating | RankSingle Female Poverty
Immigrants | Norway
63.0
/100
|
#167
Good
20.8%
Immigrants | Costa Rica
61.5
/100
|
#168
Good
20.9%
Immigrants | Trinidad and Tobago
56.3
/100
|
#169
Average
20.9%
New Zealanders
53.2
/100
|
#170
Average
21.0%
Moroccans
52.8
/100
|
#171
Average
21.0%
Guyanese
52.0
/100
|
#172
Average
21.0%
Immigrants | Guyana
50.6
/100
|
#173
Average
21.0%
Cubans
50.0
/100
|
#174
Average
21.0%
Czechs
46.8
/100
|
#175
Average
21.0%
Canadians
45.4
/100
|
#176
Average
21.1%
Scandinavians
45.2
/100
|
#177
Average
21.1%
Immigrants | Bosnia and Herzegovina
44.9
/100
|
#178
Average
21.1%
British
42.9
/100
|
#179
Average
21.1%
Spanish American Indians
42.5
/100
|
#180
Average
21.1%
Europeans
42.3
/100
|
#181
Average
21.1%