Immigrants vs Cuban Female Poverty
COMPARE
Immigrants
Cuban
Female Poverty
Female Poverty Comparison
Immigrants
Cubans
14.4%
FEMALE POVERTY
4.5/ 100
METRIC RATING
217th/ 347
METRIC RANK
15.3%
FEMALE POVERTY
0.3/ 100
METRIC RATING
246th/ 347
METRIC RANK
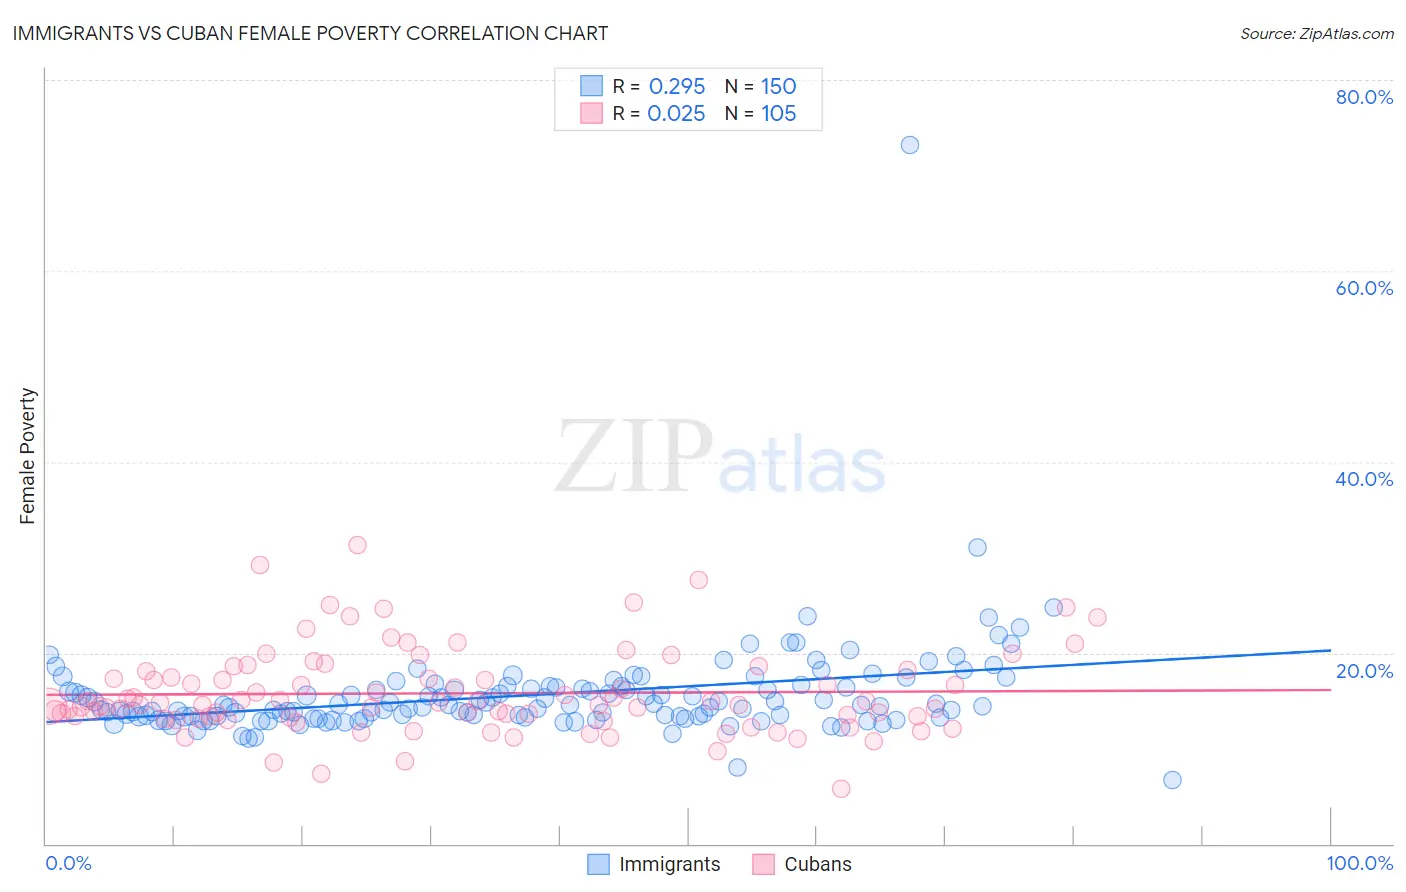
Immigrants vs Cuban Female Poverty Correlation Chart
The statistical analysis conducted on geographies consisting of 576,347,863 people shows a weak positive correlation between the proportion of Immigrants and poverty level among females in the United States with a correlation coefficient (R) of 0.295 and weighted average of 14.4%. Similarly, the statistical analysis conducted on geographies consisting of 448,858,548 people shows no correlation between the proportion of Cubans and poverty level among females in the United States with a correlation coefficient (R) of 0.025 and weighted average of 15.3%, a difference of 6.0%.
Female Poverty Correlation Summary
| Measurement | Immigrants | Cuban |
| Minimum | 6.7% | 5.8% |
| Maximum | 73.1% | 31.2% |
| Range | 66.5% | 25.5% |
| Mean | 15.6% | 15.8% |
| Median | 14.4% | 14.6% |
| Interquartile 25% (IQ1) | 13.3% | 13.2% |
| Interquartile 75% (IQ3) | 16.4% | 17.7% |
| Interquartile Range (IQR) | 3.1% | 4.5% |
| Standard Deviation (Sample) | 5.6% | 4.5% |
| Standard Deviation (Population) | 5.6% | 4.4% |
Similar Demographics by Female Poverty
Demographics Similar to Immigrants by Female Poverty
In terms of female poverty, the demographic groups most similar to Immigrants are Immigrants from Thailand (14.4%, a difference of 0.030%), Immigrants from Uzbekistan (14.4%, a difference of 0.050%), Immigrants from Panama (14.4%, a difference of 0.12%), Japanese (14.5%, a difference of 0.19%), and Alsatian (14.5%, a difference of 0.23%).
| Demographics | Rating | Rank | Female Poverty |
| Malaysians | 7.4 /100 | #210 | Tragic 14.3% |
| Moroccans | 7.2 /100 | #211 | Tragic 14.3% |
| Bermudans | 5.5 /100 | #212 | Tragic 14.4% |
| Alaskan Athabascans | 5.3 /100 | #213 | Tragic 14.4% |
| Marshallese | 5.0 /100 | #214 | Tragic 14.4% |
| Immigrants | Panama | 4.7 /100 | #215 | Tragic 14.4% |
| Immigrants | Thailand | 4.5 /100 | #216 | Tragic 14.4% |
| Immigrants | Immigrants | 4.5 /100 | #217 | Tragic 14.4% |
| Immigrants | Uzbekistan | 4.4 /100 | #218 | Tragic 14.4% |
| Japanese | 4.1 /100 | #219 | Tragic 14.5% |
| Alsatians | 4.0 /100 | #220 | Tragic 14.5% |
| Immigrants | Cambodia | 3.7 /100 | #221 | Tragic 14.5% |
| Immigrants | Nonimmigrants | 3.7 /100 | #222 | Tragic 14.5% |
| Immigrants | Africa | 3.3 /100 | #223 | Tragic 14.5% |
| Americans | 2.8 /100 | #224 | Tragic 14.6% |
Demographics Similar to Cubans by Female Poverty
In terms of female poverty, the demographic groups most similar to Cubans are Potawatomi (15.3%, a difference of 0.010%), Immigrants from Ghana (15.3%, a difference of 0.010%), Spanish American Indian (15.3%, a difference of 0.050%), Ecuadorian (15.3%, a difference of 0.15%), and Salvadoran (15.3%, a difference of 0.15%).
| Demographics | Rating | Rank | Female Poverty |
| Immigrants | Middle Africa | 0.5 /100 | #239 | Tragic 15.2% |
| Sudanese | 0.5 /100 | #240 | Tragic 15.2% |
| Immigrants | Sudan | 0.4 /100 | #241 | Tragic 15.2% |
| Nepalese | 0.4 /100 | #242 | Tragic 15.2% |
| Nicaraguans | 0.3 /100 | #243 | Tragic 15.3% |
| Ecuadorians | 0.3 /100 | #244 | Tragic 15.3% |
| Spanish American Indians | 0.3 /100 | #245 | Tragic 15.3% |
| Cubans | 0.3 /100 | #246 | Tragic 15.3% |
| Potawatomi | 0.3 /100 | #247 | Tragic 15.3% |
| Immigrants | Ghana | 0.3 /100 | #248 | Tragic 15.3% |
| Salvadorans | 0.3 /100 | #249 | Tragic 15.3% |
| Immigrants | Western Africa | 0.3 /100 | #250 | Tragic 15.3% |
| Immigrants | Trinidad and Tobago | 0.3 /100 | #251 | Tragic 15.4% |
| Immigrants | Burma/Myanmar | 0.3 /100 | #252 | Tragic 15.4% |
| Liberians | 0.2 /100 | #253 | Tragic 15.4% |