Venezuelan vs Cuban Single Female Poverty
COMPARE
Venezuelan
Cuban
Single Female Poverty
Single Female Poverty Comparison
Venezuelans
Cubans
20.4%
SINGLE FEMALE POVERTY
85.5/ 100
METRIC RATING
146th/ 347
METRIC RANK
21.0%
SINGLE FEMALE POVERTY
50.0/ 100
METRIC RATING
174th/ 347
METRIC RANK
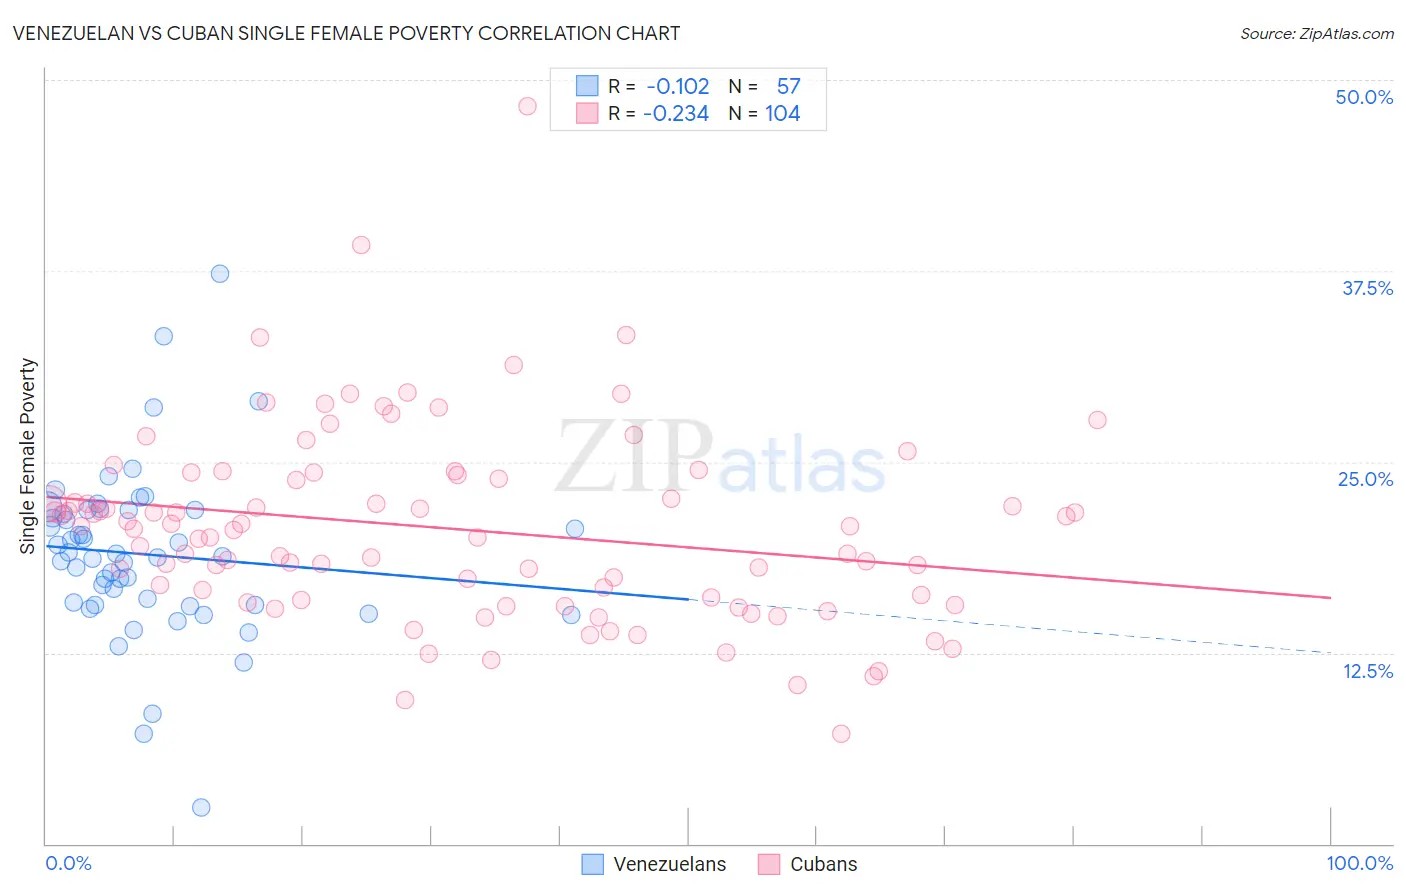
Venezuelan vs Cuban Single Female Poverty Correlation Chart
The statistical analysis conducted on geographies consisting of 303,310,735 people shows a poor negative correlation between the proportion of Venezuelans and poverty level among single females in the United States with a correlation coefficient (R) of -0.102 and weighted average of 20.4%. Similarly, the statistical analysis conducted on geographies consisting of 441,584,431 people shows a weak negative correlation between the proportion of Cubans and poverty level among single females in the United States with a correlation coefficient (R) of -0.234 and weighted average of 21.0%, a difference of 2.8%.
Single Female Poverty Correlation Summary
| Measurement | Venezuelan | Cuban |
| Minimum | 2.3% | 7.2% |
| Maximum | 37.3% | 48.3% |
| Range | 35.0% | 41.1% |
| Mean | 18.9% | 20.6% |
| Median | 18.8% | 20.6% |
| Interquartile 25% (IQ1) | 15.6% | 16.0% |
| Interquartile 75% (IQ3) | 21.8% | 24.0% |
| Interquartile Range (IQR) | 6.2% | 8.0% |
| Standard Deviation (Sample) | 5.6% | 6.3% |
| Standard Deviation (Population) | 5.5% | 6.3% |
Similar Demographics by Single Female Poverty
Demographics Similar to Venezuelans by Single Female Poverty
In terms of single female poverty, the demographic groups most similar to Venezuelans are Austrian (20.4%, a difference of 0.030%), South African (20.4%, a difference of 0.030%), Luxembourger (20.4%, a difference of 0.080%), Immigrants from Uzbekistan (20.3%, a difference of 0.39%), and Australian (20.3%, a difference of 0.40%).
| Demographics | Rating | Rank | Single Female Poverty |
| Immigrants | Kuwait | 90.4 /100 | #139 | Exceptional 20.3% |
| Syrians | 90.4 /100 | #140 | Exceptional 20.3% |
| Immigrants | North America | 89.5 /100 | #141 | Excellent 20.3% |
| Immigrants | Uganda | 89.1 /100 | #142 | Excellent 20.3% |
| Australians | 88.4 /100 | #143 | Excellent 20.3% |
| Immigrants | Uzbekistan | 88.3 /100 | #144 | Excellent 20.3% |
| Austrians | 85.8 /100 | #145 | Excellent 20.4% |
| Venezuelans | 85.5 /100 | #146 | Excellent 20.4% |
| South Africans | 85.3 /100 | #147 | Excellent 20.4% |
| Luxembourgers | 84.9 /100 | #148 | Excellent 20.4% |
| Portuguese | 81.5 /100 | #149 | Excellent 20.5% |
| Immigrants | Denmark | 80.5 /100 | #150 | Excellent 20.5% |
| Puget Sound Salish | 79.6 /100 | #151 | Good 20.6% |
| Immigrants | Uruguay | 77.7 /100 | #152 | Good 20.6% |
| Swedes | 77.1 /100 | #153 | Good 20.6% |
Demographics Similar to Cubans by Single Female Poverty
In terms of single female poverty, the demographic groups most similar to Cubans are Immigrants from Guyana (21.0%, a difference of 0.040%), Guyanese (21.0%, a difference of 0.13%), Moroccan (21.0%, a difference of 0.17%), New Zealander (21.0%, a difference of 0.20%), and Czech (21.0%, a difference of 0.20%).
| Demographics | Rating | Rank | Single Female Poverty |
| Immigrants | Norway | 63.0 /100 | #167 | Good 20.8% |
| Immigrants | Costa Rica | 61.5 /100 | #168 | Good 20.9% |
| Immigrants | Trinidad and Tobago | 56.3 /100 | #169 | Average 20.9% |
| New Zealanders | 53.2 /100 | #170 | Average 21.0% |
| Moroccans | 52.8 /100 | #171 | Average 21.0% |
| Guyanese | 52.0 /100 | #172 | Average 21.0% |
| Immigrants | Guyana | 50.6 /100 | #173 | Average 21.0% |
| Cubans | 50.0 /100 | #174 | Average 21.0% |
| Czechs | 46.8 /100 | #175 | Average 21.0% |
| Canadians | 45.4 /100 | #176 | Average 21.1% |
| Scandinavians | 45.2 /100 | #177 | Average 21.1% |
| Immigrants | Bosnia and Herzegovina | 44.9 /100 | #178 | Average 21.1% |
| British | 42.9 /100 | #179 | Average 21.1% |
| Spanish American Indians | 42.5 /100 | #180 | Average 21.1% |
| Europeans | 42.3 /100 | #181 | Average 21.1% |