Immigrants vs Immigrants from England Single Female Poverty
COMPARE
Immigrants
Immigrants from England
Single Female Poverty
Single Female Poverty Comparison
Immigrants
Immigrants from England
21.4%
SINGLE FEMALE POVERTY
22.0/ 100
METRIC RATING
199th/ 347
METRIC RANK
20.2%
SINGLE FEMALE POVERTY
91.9/ 100
METRIC RATING
133rd/ 347
METRIC RANK
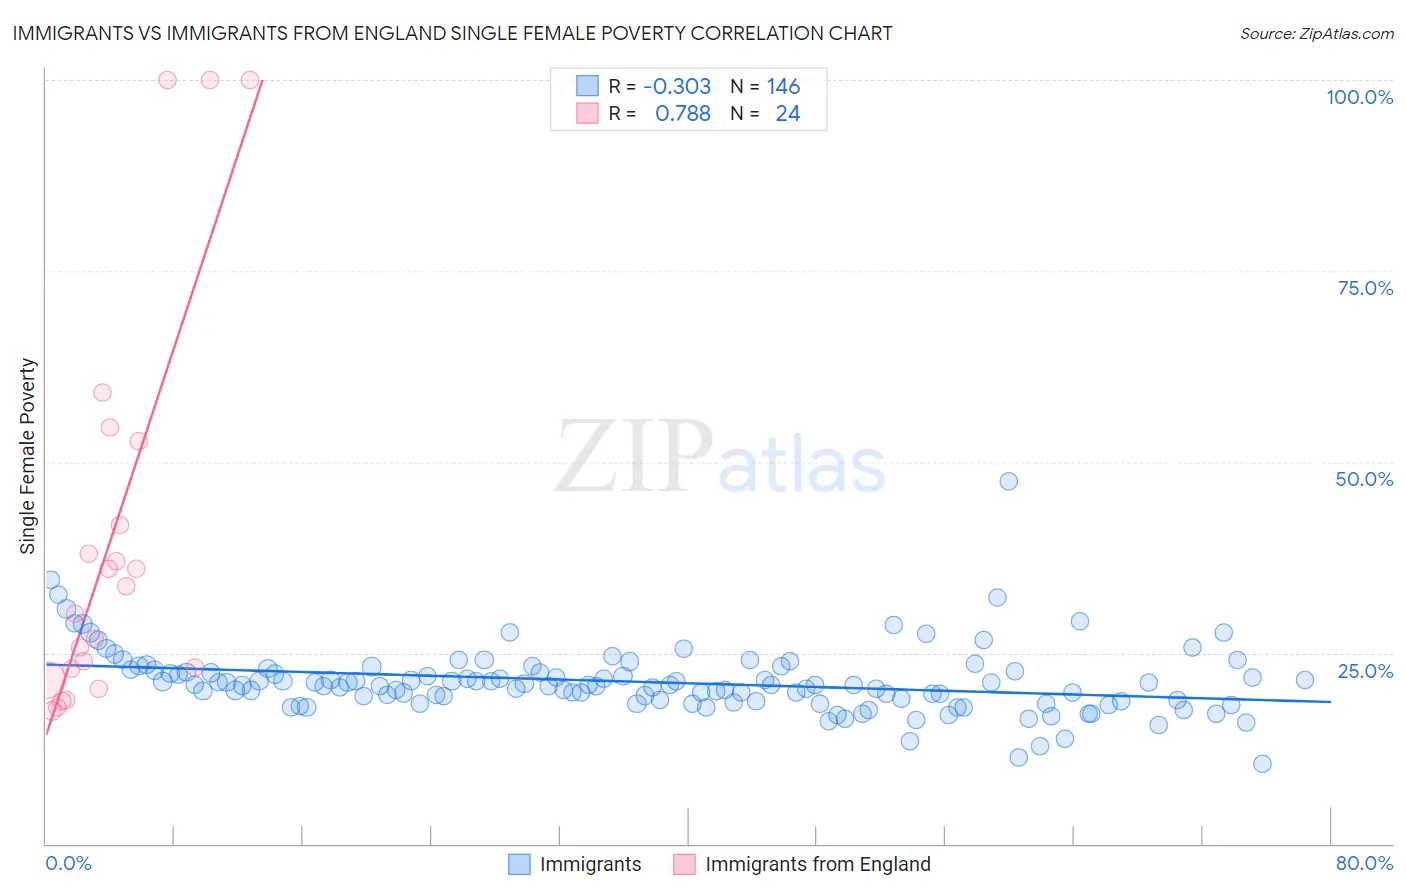
Immigrants vs Immigrants from England Single Female Poverty Correlation Chart
The statistical analysis conducted on geographies consisting of 556,808,964 people shows a mild negative correlation between the proportion of Immigrants and poverty level among single females in the United States with a correlation coefficient (R) of -0.303 and weighted average of 21.4%. Similarly, the statistical analysis conducted on geographies consisting of 384,642,935 people shows a strong positive correlation between the proportion of Immigrants from England and poverty level among single females in the United States with a correlation coefficient (R) of 0.788 and weighted average of 20.2%, a difference of 6.0%.
Single Female Poverty Correlation Summary
| Measurement | Immigrants | Immigrants from England |
| Minimum | 10.5% | 17.4% |
| Maximum | 47.5% | 100.0% |
| Range | 36.9% | 82.6% |
| Mean | 21.2% | 39.8% |
| Median | 20.7% | 32.0% |
| Interquartile 25% (IQ1) | 18.9% | 22.2% |
| Interquartile 75% (IQ3) | 22.6% | 47.2% |
| Interquartile Range (IQR) | 3.8% | 25.0% |
| Standard Deviation (Sample) | 4.4% | 26.0% |
| Standard Deviation (Population) | 4.4% | 25.5% |
Similar Demographics by Single Female Poverty
Demographics Similar to Immigrants by Single Female Poverty
In terms of single female poverty, the demographic groups most similar to Immigrants are Irish (21.4%, a difference of 0.050%), Nigerian (21.4%, a difference of 0.10%), Immigrants from Kenya (21.4%, a difference of 0.12%), Swiss (21.4%, a difference of 0.19%), and Immigrants from Haiti (21.5%, a difference of 0.30%).
| Demographics | Rating | Rank | Single Female Poverty |
| Immigrants | Jamaica | 30.5 /100 | #192 | Fair 21.3% |
| Basques | 28.1 /100 | #193 | Fair 21.3% |
| Czechoslovakians | 27.7 /100 | #194 | Fair 21.3% |
| Nicaraguans | 27.6 /100 | #195 | Fair 21.3% |
| Immigrants | Saudi Arabia | 27.1 /100 | #196 | Fair 21.3% |
| Japanese | 26.4 /100 | #197 | Fair 21.3% |
| Swiss | 24.2 /100 | #198 | Fair 21.4% |
| Immigrants | Immigrants | 22.0 /100 | #199 | Fair 21.4% |
| Irish | 21.4 /100 | #200 | Fair 21.4% |
| Nigerians | 20.9 /100 | #201 | Fair 21.4% |
| Immigrants | Kenya | 20.7 /100 | #202 | Fair 21.4% |
| Immigrants | Haiti | 18.8 /100 | #203 | Poor 21.5% |
| Immigrants | Africa | 16.7 /100 | #204 | Poor 21.5% |
| Finns | 16.2 /100 | #205 | Poor 21.5% |
| Belgians | 16.1 /100 | #206 | Poor 21.5% |
Demographics Similar to Immigrants from England by Single Female Poverty
In terms of single female poverty, the demographic groups most similar to Immigrants from England are Pakistani (20.2%, a difference of 0.030%), Uruguayan (20.2%, a difference of 0.030%), Immigrants from Hungary (20.2%, a difference of 0.090%), Immigrants from Venezuela (20.2%, a difference of 0.090%), and Immigrants from Morocco (20.2%, a difference of 0.11%).
| Demographics | Rating | Rank | Single Female Poverty |
| Serbians | 93.3 /100 | #126 | Exceptional 20.1% |
| Mongolians | 93.2 /100 | #127 | Exceptional 20.2% |
| Immigrants | Spain | 92.7 /100 | #128 | Exceptional 20.2% |
| Immigrants | Morocco | 92.4 /100 | #129 | Exceptional 20.2% |
| Immigrants | Hungary | 92.3 /100 | #130 | Exceptional 20.2% |
| Pakistanis | 92.1 /100 | #131 | Exceptional 20.2% |
| Uruguayans | 92.1 /100 | #132 | Exceptional 20.2% |
| Immigrants | England | 91.9 /100 | #133 | Exceptional 20.2% |
| Immigrants | Venezuela | 91.5 /100 | #134 | Exceptional 20.2% |
| Immigrants | Iraq | 91.2 /100 | #135 | Exceptional 20.2% |
| Immigrants | Canada | 91.2 /100 | #136 | Exceptional 20.2% |
| Immigrants | Nepal | 90.6 /100 | #137 | Exceptional 20.3% |
| Slovenes | 90.5 /100 | #138 | Exceptional 20.3% |
| Immigrants | Kuwait | 90.4 /100 | #139 | Exceptional 20.3% |
| Syrians | 90.4 /100 | #140 | Exceptional 20.3% |