Immigrants vs Fijian Single Female Poverty
COMPARE
Immigrants
Fijian
Single Female Poverty
Single Female Poverty Comparison
Immigrants
Fijians
21.4%
SINGLE FEMALE POVERTY
22.0/ 100
METRIC RATING
199th/ 347
METRIC RANK
23.1%
SINGLE FEMALE POVERTY
0.2/ 100
METRIC RATING
268th/ 347
METRIC RANK
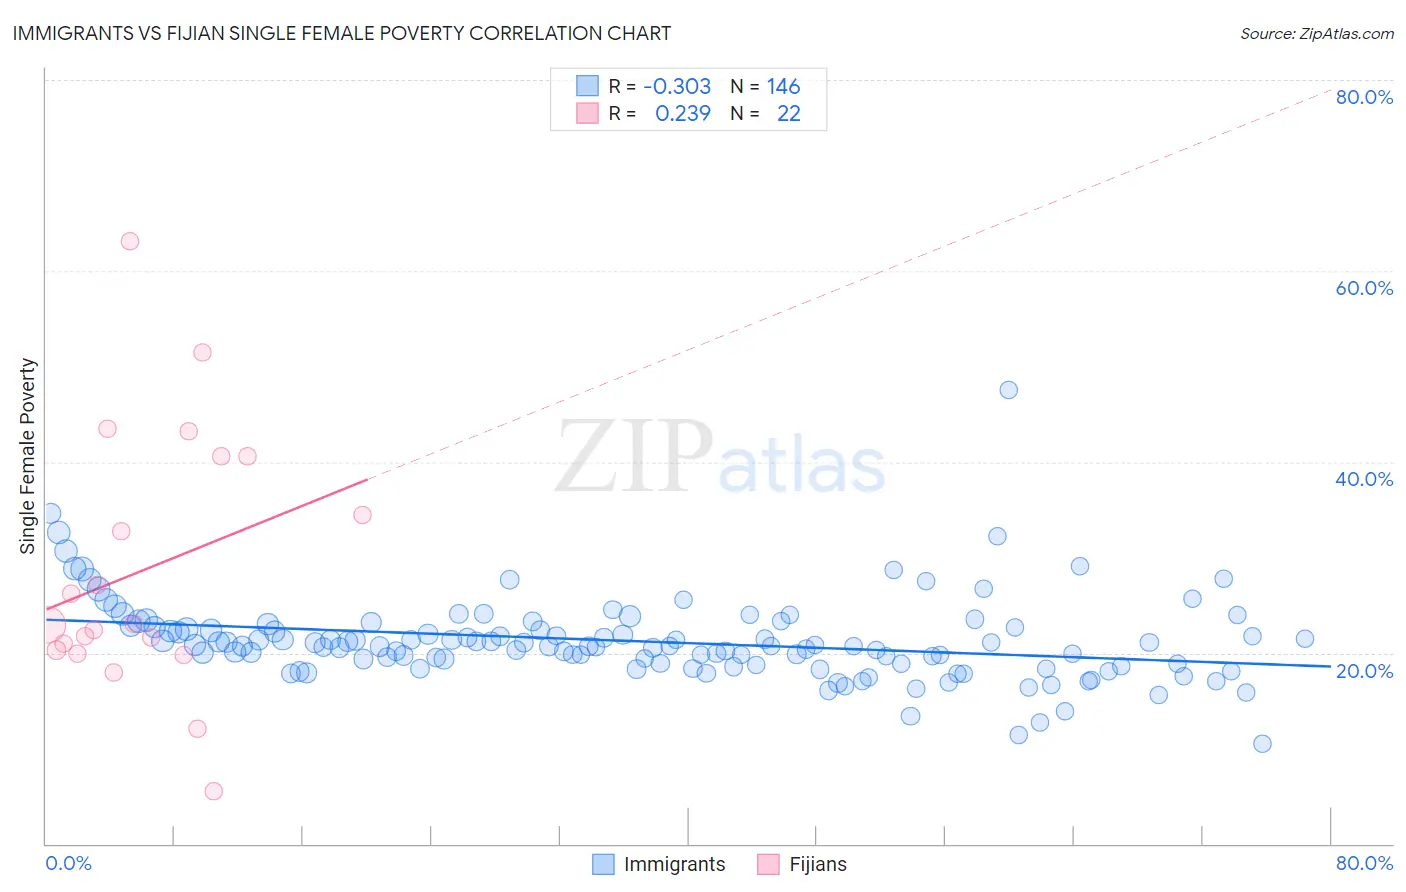
Immigrants vs Fijian Single Female Poverty Correlation Chart
The statistical analysis conducted on geographies consisting of 556,808,964 people shows a mild negative correlation between the proportion of Immigrants and poverty level among single females in the United States with a correlation coefficient (R) of -0.303 and weighted average of 21.4%. Similarly, the statistical analysis conducted on geographies consisting of 55,892,814 people shows a weak positive correlation between the proportion of Fijians and poverty level among single females in the United States with a correlation coefficient (R) of 0.239 and weighted average of 23.1%, a difference of 7.7%.
Single Female Poverty Correlation Summary
| Measurement | Immigrants | Fijian |
| Minimum | 10.5% | 5.6% |
| Maximum | 47.5% | 63.2% |
| Range | 36.9% | 57.6% |
| Mean | 21.2% | 28.7% |
| Median | 20.7% | 23.0% |
| Interquartile 25% (IQ1) | 18.9% | 20.3% |
| Interquartile 75% (IQ3) | 22.6% | 40.6% |
| Interquartile Range (IQR) | 3.8% | 20.3% |
| Standard Deviation (Sample) | 4.4% | 13.6% |
| Standard Deviation (Population) | 4.4% | 13.3% |
Similar Demographics by Single Female Poverty
Demographics Similar to Immigrants by Single Female Poverty
In terms of single female poverty, the demographic groups most similar to Immigrants are Irish (21.4%, a difference of 0.050%), Nigerian (21.4%, a difference of 0.10%), Immigrants from Kenya (21.4%, a difference of 0.12%), Swiss (21.4%, a difference of 0.19%), and Immigrants from Haiti (21.5%, a difference of 0.30%).
| Demographics | Rating | Rank | Single Female Poverty |
| Immigrants | Jamaica | 30.5 /100 | #192 | Fair 21.3% |
| Basques | 28.1 /100 | #193 | Fair 21.3% |
| Czechoslovakians | 27.7 /100 | #194 | Fair 21.3% |
| Nicaraguans | 27.6 /100 | #195 | Fair 21.3% |
| Immigrants | Saudi Arabia | 27.1 /100 | #196 | Fair 21.3% |
| Japanese | 26.4 /100 | #197 | Fair 21.3% |
| Swiss | 24.2 /100 | #198 | Fair 21.4% |
| Immigrants | Immigrants | 22.0 /100 | #199 | Fair 21.4% |
| Irish | 21.4 /100 | #200 | Fair 21.4% |
| Nigerians | 20.9 /100 | #201 | Fair 21.4% |
| Immigrants | Kenya | 20.7 /100 | #202 | Fair 21.4% |
| Immigrants | Haiti | 18.8 /100 | #203 | Poor 21.5% |
| Immigrants | Africa | 16.7 /100 | #204 | Poor 21.5% |
| Finns | 16.2 /100 | #205 | Poor 21.5% |
| Belgians | 16.1 /100 | #206 | Poor 21.5% |
Demographics Similar to Fijians by Single Female Poverty
In terms of single female poverty, the demographic groups most similar to Fijians are Hmong (23.1%, a difference of 0.030%), Senegalese (23.0%, a difference of 0.070%), Immigrants from Micronesia (23.0%, a difference of 0.13%), Inupiat (23.1%, a difference of 0.28%), and Central American (23.0%, a difference of 0.34%).
| Demographics | Rating | Rank | Single Female Poverty |
| Immigrants | Cabo Verde | 0.4 /100 | #261 | Tragic 22.8% |
| British West Indians | 0.4 /100 | #262 | Tragic 22.8% |
| Scotch-Irish | 0.3 /100 | #263 | Tragic 22.9% |
| Immigrants | Laos | 0.3 /100 | #264 | Tragic 22.9% |
| Central Americans | 0.2 /100 | #265 | Tragic 23.0% |
| Immigrants | Micronesia | 0.2 /100 | #266 | Tragic 23.0% |
| Senegalese | 0.2 /100 | #267 | Tragic 23.0% |
| Fijians | 0.2 /100 | #268 | Tragic 23.1% |
| Hmong | 0.2 /100 | #269 | Tragic 23.1% |
| Inupiat | 0.2 /100 | #270 | Tragic 23.1% |
| Sub-Saharan Africans | 0.1 /100 | #271 | Tragic 23.2% |
| Immigrants | Senegal | 0.1 /100 | #272 | Tragic 23.2% |
| Alaska Natives | 0.1 /100 | #273 | Tragic 23.3% |
| Marshallese | 0.1 /100 | #274 | Tragic 23.3% |
| Mexican American Indians | 0.1 /100 | #275 | Tragic 23.4% |