Uruguayan vs Cuban Single Female Poverty
COMPARE
Uruguayan
Cuban
Single Female Poverty
Single Female Poverty Comparison
Uruguayans
Cubans
20.2%
SINGLE FEMALE POVERTY
92.1/ 100
METRIC RATING
132nd/ 347
METRIC RANK
21.0%
SINGLE FEMALE POVERTY
50.0/ 100
METRIC RATING
174th/ 347
METRIC RANK
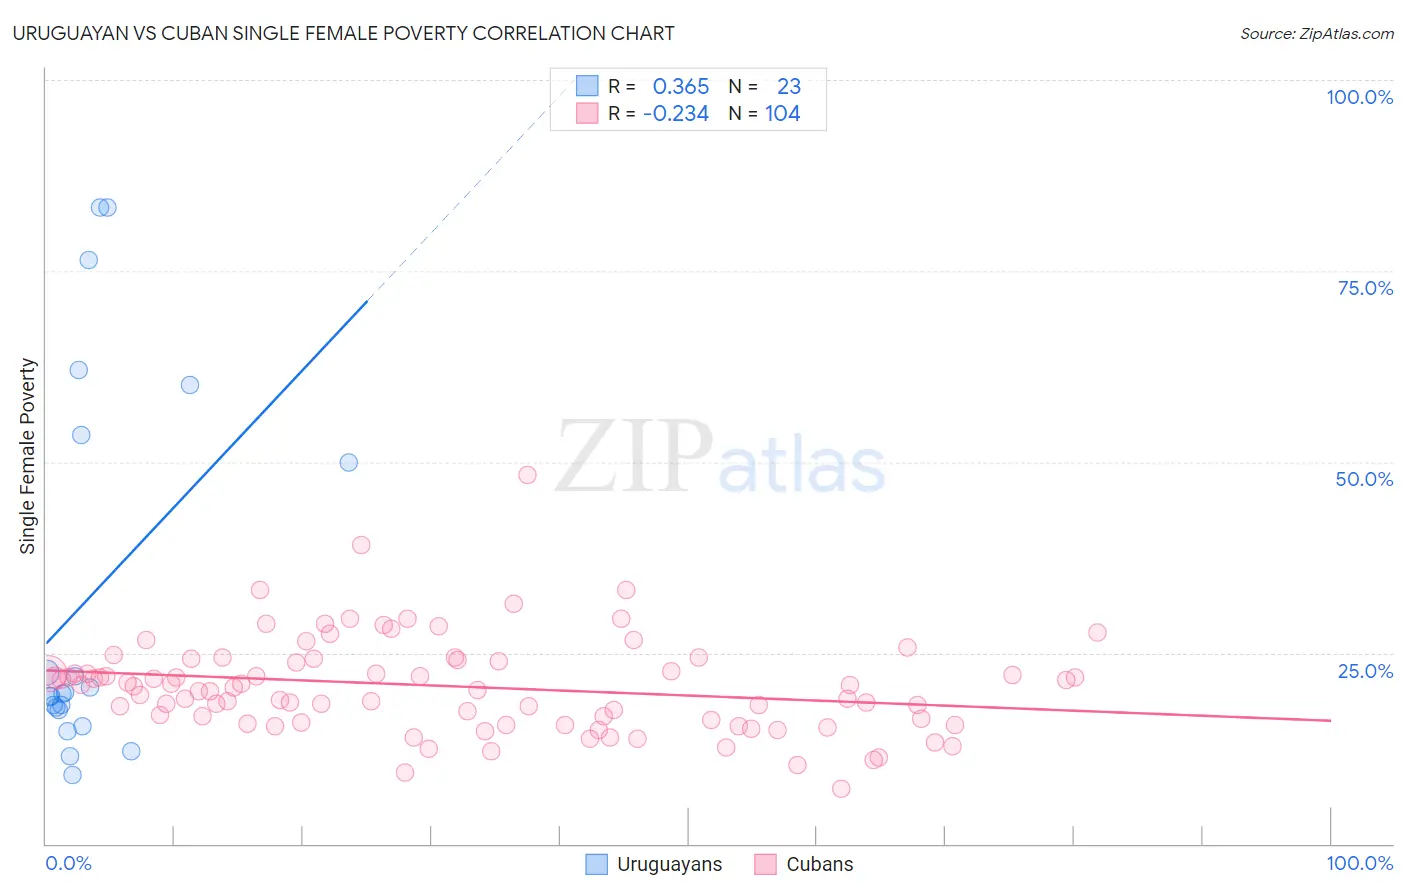
Uruguayan vs Cuban Single Female Poverty Correlation Chart
The statistical analysis conducted on geographies consisting of 143,837,387 people shows a mild positive correlation between the proportion of Uruguayans and poverty level among single females in the United States with a correlation coefficient (R) of 0.365 and weighted average of 20.2%. Similarly, the statistical analysis conducted on geographies consisting of 441,584,431 people shows a weak negative correlation between the proportion of Cubans and poverty level among single females in the United States with a correlation coefficient (R) of -0.234 and weighted average of 21.0%, a difference of 4.0%.
Single Female Poverty Correlation Summary
| Measurement | Uruguayan | Cuban |
| Minimum | 9.0% | 7.2% |
| Maximum | 83.3% | 48.3% |
| Range | 74.3% | 41.1% |
| Mean | 32.4% | 20.6% |
| Median | 19.7% | 20.6% |
| Interquartile 25% (IQ1) | 17.5% | 16.0% |
| Interquartile 75% (IQ3) | 53.6% | 24.0% |
| Interquartile Range (IQR) | 36.1% | 8.0% |
| Standard Deviation (Sample) | 24.7% | 6.3% |
| Standard Deviation (Population) | 24.1% | 6.3% |
Similar Demographics by Single Female Poverty
Demographics Similar to Uruguayans by Single Female Poverty
In terms of single female poverty, the demographic groups most similar to Uruguayans are Pakistani (20.2%, a difference of 0.0%), Immigrants from England (20.2%, a difference of 0.030%), Immigrants from Hungary (20.2%, a difference of 0.050%), Immigrants from Morocco (20.2%, a difference of 0.080%), and Immigrants from Venezuela (20.2%, a difference of 0.12%).
| Demographics | Rating | Rank | Single Female Poverty |
| Immigrants | South Africa | 93.9 /100 | #125 | Exceptional 20.1% |
| Serbians | 93.3 /100 | #126 | Exceptional 20.1% |
| Mongolians | 93.2 /100 | #127 | Exceptional 20.2% |
| Immigrants | Spain | 92.7 /100 | #128 | Exceptional 20.2% |
| Immigrants | Morocco | 92.4 /100 | #129 | Exceptional 20.2% |
| Immigrants | Hungary | 92.3 /100 | #130 | Exceptional 20.2% |
| Pakistanis | 92.1 /100 | #131 | Exceptional 20.2% |
| Uruguayans | 92.1 /100 | #132 | Exceptional 20.2% |
| Immigrants | England | 91.9 /100 | #133 | Exceptional 20.2% |
| Immigrants | Venezuela | 91.5 /100 | #134 | Exceptional 20.2% |
| Immigrants | Iraq | 91.2 /100 | #135 | Exceptional 20.2% |
| Immigrants | Canada | 91.2 /100 | #136 | Exceptional 20.2% |
| Immigrants | Nepal | 90.6 /100 | #137 | Exceptional 20.3% |
| Slovenes | 90.5 /100 | #138 | Exceptional 20.3% |
| Immigrants | Kuwait | 90.4 /100 | #139 | Exceptional 20.3% |
Demographics Similar to Cubans by Single Female Poverty
In terms of single female poverty, the demographic groups most similar to Cubans are Immigrants from Guyana (21.0%, a difference of 0.040%), Guyanese (21.0%, a difference of 0.13%), Moroccan (21.0%, a difference of 0.17%), New Zealander (21.0%, a difference of 0.20%), and Czech (21.0%, a difference of 0.20%).
| Demographics | Rating | Rank | Single Female Poverty |
| Immigrants | Norway | 63.0 /100 | #167 | Good 20.8% |
| Immigrants | Costa Rica | 61.5 /100 | #168 | Good 20.9% |
| Immigrants | Trinidad and Tobago | 56.3 /100 | #169 | Average 20.9% |
| New Zealanders | 53.2 /100 | #170 | Average 21.0% |
| Moroccans | 52.8 /100 | #171 | Average 21.0% |
| Guyanese | 52.0 /100 | #172 | Average 21.0% |
| Immigrants | Guyana | 50.6 /100 | #173 | Average 21.0% |
| Cubans | 50.0 /100 | #174 | Average 21.0% |
| Czechs | 46.8 /100 | #175 | Average 21.0% |
| Canadians | 45.4 /100 | #176 | Average 21.1% |
| Scandinavians | 45.2 /100 | #177 | Average 21.1% |
| Immigrants | Bosnia and Herzegovina | 44.9 /100 | #178 | Average 21.1% |
| British | 42.9 /100 | #179 | Average 21.1% |
| Spanish American Indians | 42.5 /100 | #180 | Average 21.1% |
| Europeans | 42.3 /100 | #181 | Average 21.1% |