Immigrants from Western Asia vs Paraguayan Married-Couple Family Poverty
COMPARE
Immigrants from Western Asia
Paraguayan
Married-Couple Family Poverty
Married-Couple Family Poverty Comparison
Immigrants from Western Asia
Paraguayans
6.0%
MARRIED-COUPLE FAMILY POVERTY
0.7/ 100
METRIC RATING
252nd/ 347
METRIC RANK
5.1%
MARRIED-COUPLE FAMILY POVERTY
61.5/ 100
METRIC RATING
166th/ 347
METRIC RANK
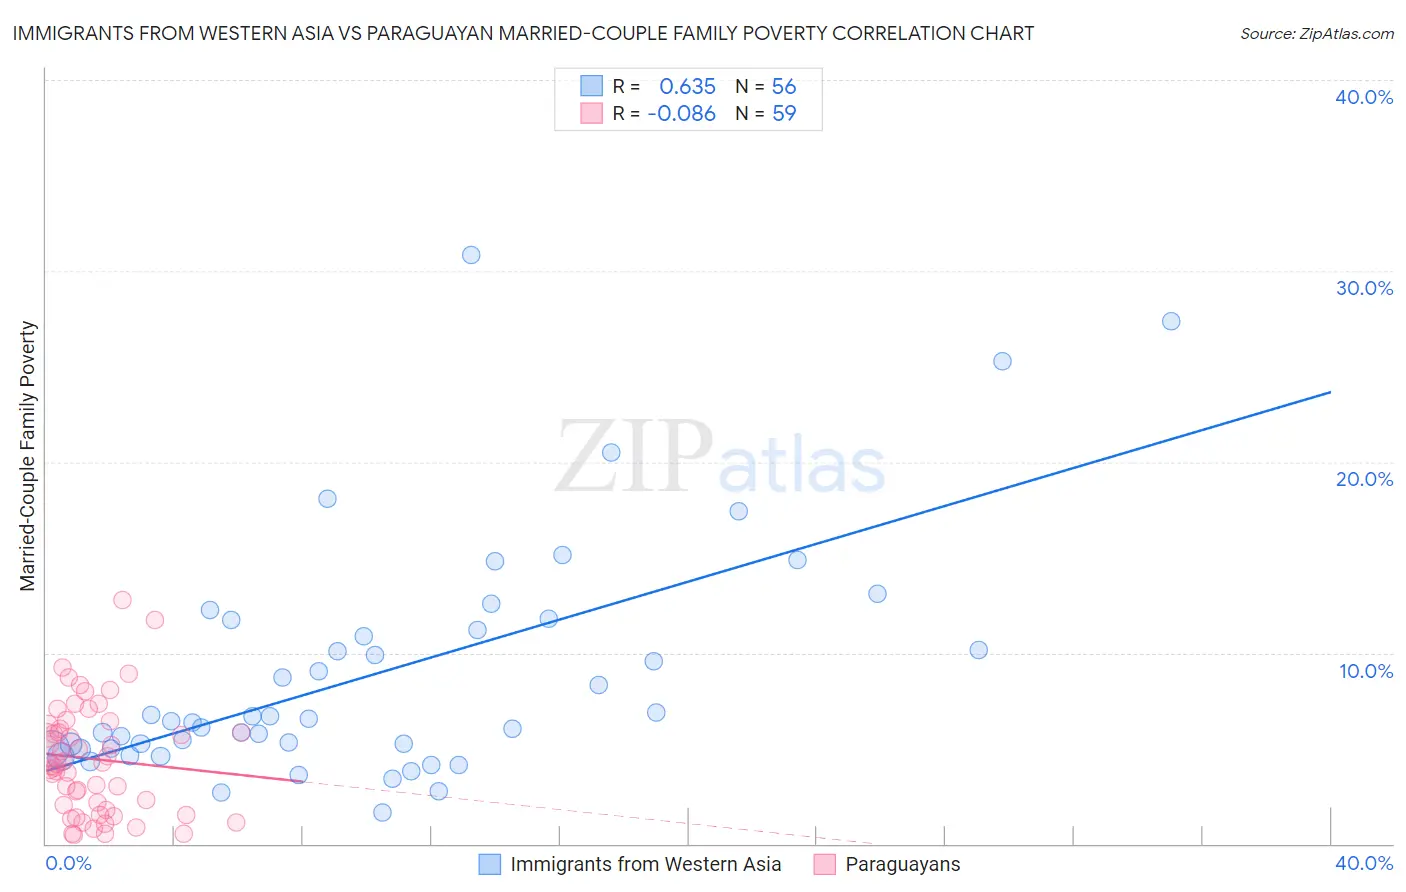
Immigrants from Western Asia vs Paraguayan Married-Couple Family Poverty Correlation Chart
The statistical analysis conducted on geographies consisting of 400,576,171 people shows a significant positive correlation between the proportion of Immigrants from Western Asia and poverty level among married-couple families in the United States with a correlation coefficient (R) of 0.635 and weighted average of 6.0%. Similarly, the statistical analysis conducted on geographies consisting of 94,718,815 people shows a slight negative correlation between the proportion of Paraguayans and poverty level among married-couple families in the United States with a correlation coefficient (R) of -0.086 and weighted average of 5.1%, a difference of 15.8%.
Married-Couple Family Poverty Correlation Summary
| Measurement | Immigrants from Western Asia | Paraguayan |
| Minimum | 1.7% | 0.45% |
| Maximum | 30.8% | 12.8% |
| Range | 29.2% | 12.3% |
| Mean | 8.9% | 4.4% |
| Median | 6.5% | 4.2% |
| Interquartile 25% (IQ1) | 5.0% | 1.8% |
| Interquartile 75% (IQ3) | 11.5% | 6.2% |
| Interquartile Range (IQR) | 6.5% | 4.4% |
| Standard Deviation (Sample) | 6.2% | 2.9% |
| Standard Deviation (Population) | 6.1% | 2.9% |
Similar Demographics by Married-Couple Family Poverty
Demographics Similar to Immigrants from Western Asia by Married-Couple Family Poverty
In terms of married-couple family poverty, the demographic groups most similar to Immigrants from Western Asia are African (6.0%, a difference of 0.090%), Immigrants from Somalia (6.0%, a difference of 0.15%), Comanche (6.0%, a difference of 0.30%), Immigrants from Ghana (5.9%, a difference of 0.64%), and Bangladeshi (6.0%, a difference of 0.80%).
| Demographics | Rating | Rank | Married-Couple Family Poverty |
| Immigrants | Afghanistan | 2.1 /100 | #245 | Tragic 5.8% |
| Immigrants | Venezuela | 1.8 /100 | #246 | Tragic 5.8% |
| Iraqis | 1.4 /100 | #247 | Tragic 5.9% |
| Cree | 1.2 /100 | #248 | Tragic 5.9% |
| Tsimshian | 1.1 /100 | #249 | Tragic 5.9% |
| Immigrants | Eritrea | 1.1 /100 | #250 | Tragic 5.9% |
| Immigrants | Ghana | 1.0 /100 | #251 | Tragic 5.9% |
| Immigrants | Western Asia | 0.7 /100 | #252 | Tragic 6.0% |
| Africans | 0.7 /100 | #253 | Tragic 6.0% |
| Immigrants | Somalia | 0.7 /100 | #254 | Tragic 6.0% |
| Comanche | 0.7 /100 | #255 | Tragic 6.0% |
| Bangladeshis | 0.5 /100 | #256 | Tragic 6.0% |
| Immigrants | Burma/Myanmar | 0.5 /100 | #257 | Tragic 6.0% |
| Immigrants | Immigrants | 0.5 /100 | #258 | Tragic 6.0% |
| Alaskan Athabascans | 0.4 /100 | #259 | Tragic 6.1% |
Demographics Similar to Paraguayans by Married-Couple Family Poverty
In terms of married-couple family poverty, the demographic groups most similar to Paraguayans are Costa Rican (5.1%, a difference of 0.0%), Immigrants from Malaysia (5.1%, a difference of 0.090%), Hawaiian (5.1%, a difference of 0.10%), Sierra Leonean (5.1%, a difference of 0.34%), and Immigrants from Jordan (5.1%, a difference of 0.65%).
| Demographics | Rating | Rank | Married-Couple Family Poverty |
| Immigrants | Saudi Arabia | 70.3 /100 | #159 | Good 5.1% |
| Pennsylvania Germans | 68.5 /100 | #160 | Good 5.1% |
| Ethiopians | 68.1 /100 | #161 | Good 5.1% |
| Immigrants | Jordan | 66.5 /100 | #162 | Good 5.1% |
| Sierra Leoneans | 64.1 /100 | #163 | Good 5.1% |
| Hawaiians | 62.3 /100 | #164 | Good 5.1% |
| Immigrants | Malaysia | 62.2 /100 | #165 | Good 5.1% |
| Paraguayans | 61.5 /100 | #166 | Good 5.1% |
| Costa Ricans | 61.5 /100 | #167 | Good 5.1% |
| Immigrants | Uganda | 54.9 /100 | #168 | Average 5.2% |
| Ottawa | 54.5 /100 | #169 | Average 5.2% |
| Immigrants | Argentina | 54.4 /100 | #170 | Average 5.2% |
| Bermudans | 52.9 /100 | #171 | Average 5.2% |
| Immigrants | Northern Africa | 51.3 /100 | #172 | Average 5.2% |
| Alsatians | 51.2 /100 | #173 | Average 5.2% |