Immigrants from Ukraine vs Choctaw Married-Couple Family Poverty
COMPARE
Immigrants from Ukraine
Choctaw
Married-Couple Family Poverty
Married-Couple Family Poverty Comparison
Immigrants from Ukraine
Choctaw
5.2%
MARRIED-COUPLE FAMILY POVERTY
44.9/ 100
METRIC RATING
178th/ 347
METRIC RANK
6.3%
MARRIED-COUPLE FAMILY POVERTY
0.1/ 100
METRIC RATING
275th/ 347
METRIC RANK
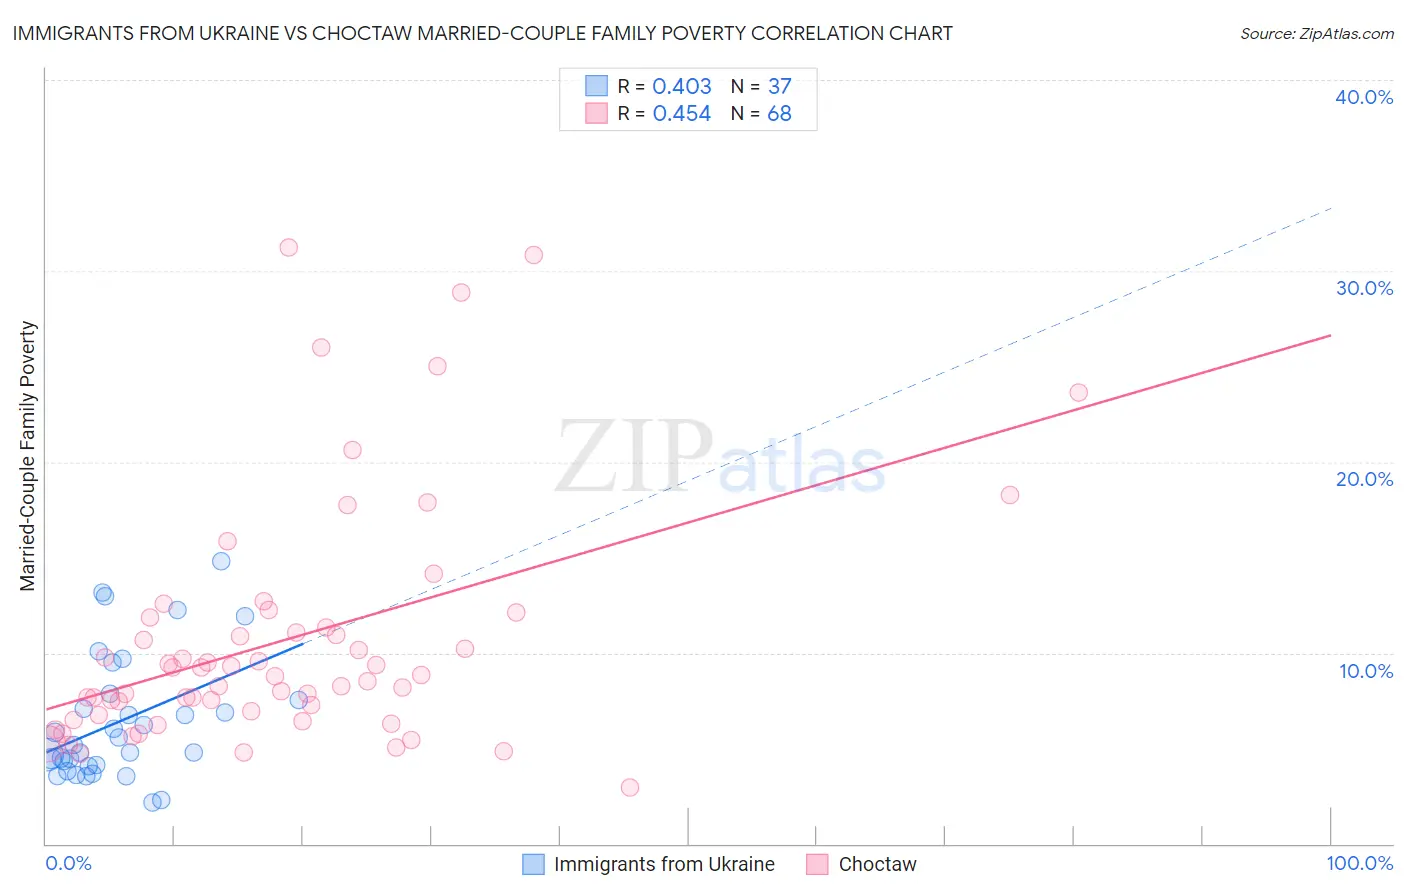
Immigrants from Ukraine vs Choctaw Married-Couple Family Poverty Correlation Chart
The statistical analysis conducted on geographies consisting of 287,534,974 people shows a moderate positive correlation between the proportion of Immigrants from Ukraine and poverty level among married-couple families in the United States with a correlation coefficient (R) of 0.403 and weighted average of 5.2%. Similarly, the statistical analysis conducted on geographies consisting of 268,584,402 people shows a moderate positive correlation between the proportion of Choctaw and poverty level among married-couple families in the United States with a correlation coefficient (R) of 0.454 and weighted average of 6.3%, a difference of 19.9%.
Married-Couple Family Poverty Correlation Summary
| Measurement | Immigrants from Ukraine | Choctaw |
| Minimum | 2.1% | 3.0% |
| Maximum | 14.8% | 31.2% |
| Range | 12.7% | 28.3% |
| Mean | 6.4% | 10.7% |
| Median | 5.2% | 8.8% |
| Interquartile 25% (IQ1) | 4.1% | 6.8% |
| Interquartile 75% (IQ3) | 7.7% | 11.6% |
| Interquartile Range (IQR) | 3.6% | 4.8% |
| Standard Deviation (Sample) | 3.3% | 6.4% |
| Standard Deviation (Population) | 3.2% | 6.3% |
Similar Demographics by Married-Couple Family Poverty
Demographics Similar to Immigrants from Ukraine by Married-Couple Family Poverty
In terms of married-couple family poverty, the demographic groups most similar to Immigrants from Ukraine are Immigrants from Kazakhstan (5.2%, a difference of 0.020%), Menominee (5.2%, a difference of 0.34%), Marshallese (5.2%, a difference of 0.35%), Spanish (5.3%, a difference of 0.42%), and Immigrants from Eastern Africa (5.2%, a difference of 0.59%).
| Demographics | Rating | Rank | Married-Couple Family Poverty |
| Bermudans | 52.9 /100 | #171 | Average 5.2% |
| Immigrants | Northern Africa | 51.3 /100 | #172 | Average 5.2% |
| Alsatians | 51.2 /100 | #173 | Average 5.2% |
| Immigrants | Eastern Africa | 50.0 /100 | #174 | Average 5.2% |
| Marshallese | 47.9 /100 | #175 | Average 5.2% |
| Menominee | 47.8 /100 | #176 | Average 5.2% |
| Immigrants | Kazakhstan | 45.1 /100 | #177 | Average 5.2% |
| Immigrants | Ukraine | 44.9 /100 | #178 | Average 5.2% |
| Spanish | 41.4 /100 | #179 | Average 5.3% |
| Immigrants | Sierra Leone | 39.3 /100 | #180 | Fair 5.3% |
| Immigrants | Chile | 38.8 /100 | #181 | Fair 5.3% |
| Immigrants | Vietnam | 37.7 /100 | #182 | Fair 5.3% |
| Peruvians | 37.6 /100 | #183 | Fair 5.3% |
| Immigrants | Nonimmigrants | 35.8 /100 | #184 | Fair 5.3% |
| Americans | 35.4 /100 | #185 | Fair 5.3% |
Demographics Similar to Choctaw by Married-Couple Family Poverty
In terms of married-couple family poverty, the demographic groups most similar to Choctaw are Barbadian (6.3%, a difference of 0.16%), Colville (6.3%, a difference of 0.21%), Yaqui (6.3%, a difference of 0.45%), Indonesian (6.3%, a difference of 0.59%), and Trinidadian and Tobagonian (6.2%, a difference of 0.99%).
| Demographics | Rating | Rank | Married-Couple Family Poverty |
| Alaska Natives | 0.2 /100 | #268 | Tragic 6.2% |
| Immigrants | West Indies | 0.1 /100 | #269 | Tragic 6.2% |
| Immigrants | Jamaica | 0.1 /100 | #270 | Tragic 6.2% |
| Immigrants | Bahamas | 0.1 /100 | #271 | Tragic 6.2% |
| Trinidadians and Tobagonians | 0.1 /100 | #272 | Tragic 6.2% |
| Colville | 0.1 /100 | #273 | Tragic 6.3% |
| Barbadians | 0.1 /100 | #274 | Tragic 6.3% |
| Choctaw | 0.1 /100 | #275 | Tragic 6.3% |
| Yaqui | 0.1 /100 | #276 | Tragic 6.3% |
| Indonesians | 0.1 /100 | #277 | Tragic 6.3% |
| Immigrants | Trinidad and Tobago | 0.1 /100 | #278 | Tragic 6.4% |
| Houma | 0.0 /100 | #279 | Tragic 6.4% |
| West Indians | 0.0 /100 | #280 | Tragic 6.4% |
| Mexican American Indians | 0.0 /100 | #281 | Tragic 6.4% |
| Seminole | 0.0 /100 | #282 | Tragic 6.4% |