Immigrants from South Africa vs Hmong Married-Couple Family Poverty

COMPARE

Immigrants from South Africa
Race
Ancestry
AfghanAfricanAlaska NativeAlaskan AthabascanAlbanianAleutAlsatianAmericanApacheArabArapahoArgentineanArmenianAssyrian/Chaldean/SyriacAustralianAustrianBahamianBangladeshiBarbadianBasqueBelgianBelizeanBermudanBhutaneseBlackfeetBolivianBrazilianBritishBritish West IndianBulgarianBurmeseCajunCambodianCanadianCape VerdeanCarpatho RusynCelticCentral AmericanCentral American IndianCherokeeCheyenneChickasawChileanChineseChippewaChoctawColombianColvilleComancheCosta RicanCreeCreekCroatianCrowCubanCypriotCzechCzechoslovakianDanishDelawareDominicanDutchDutch West IndianEastern EuropeanEcuadorianEgyptianEnglishEstonianEthiopianEuropeanFijianFilipinoFinnishFrenchFrench American IndianFrench CanadianGermanGerman RussianGhanaianGreekGuamanian/ChamorroGuatemalanGuyaneseHaitianHonduranHopiHoumaHungarianIcelanderIndian (Asian)IndonesianInupiatIranianIraqiIrishIroquoisIsraeliItalianJamaicanJapaneseJordanianKenyanKiowaKoreanLaotianLatvianLebaneseLiberianLithuanianLumbeeLuxembourgerMacedonianMalaysianMalteseMarshalleseMenomineeMexicanMexican American IndianMongolianMoroccanNative HawaiianNavajoNepaleseNew ZealanderNicaraguanNigerianNorthern EuropeanNorwegianOkinawanOsageOttawaPaiutePakistaniPalestinianPanamanianParaguayanPennsylvania GermanPeruvianPimaPolishPortuguesePotawatomiPuebloPuerto RicanPuget Sound SalishRomanianRussianSalvadoranSamoanScandinavianScotch-IrishScottishSeminoleSenegaleseSerbianShoshoneSierra LeoneanSiouxSlavicSlovakSloveneSomaliSouth AfricanSouth AmericanSouth American IndianSoviet UnionSpaniardSpanishSpanish AmericanSpanish American IndianSri LankanSubsaharan AfricanSudaneseSwedishSwissSyrianTaiwaneseThaiTlingit-HaidaTohono O'OdhamTonganTrinidadian and TobagonianTsimshianTurkishU.S. Virgin IslanderUgandanUkrainianUruguayanUteVenezuelanVietnameseWelshWest IndianYakamaYaquiYugoslavianYumanYup'ikZimbabwean
Immigration
NonimmigrantsImmigrantsAfghanistanAfricaAlbaniaArgentinaArmeniaAsiaAustraliaAustriaBahamasBangladeshBarbadosBelarusBelgiumBelizeBoliviaBosnia and HerzegovinaBrazilBulgariaBurma/MyanmarCabo VerdeCambodiaCameroonCanadaCaribbeanCentral AmericaChileChinaColombiaCongoCosta RicaCroatiaCubaCzechoslovakiaDenmarkDominicaDominican RepublicEastern AfricaEastern AsiaEastern EuropeEcuadorEgyptEl SalvadorEnglandEritreaEthiopiaEuropeFijiFranceGermanyGhanaGreeceGrenadaGuatemalaGuyanaHaitiHondurasHong KongHungaryIndiaIndonesiaIranIraqIrelandIsraelItalyJamaicaJapanJordanKazakhstanKenyaKoreaKuwaitLaosLatin AmericaLatviaLebanonLiberiaLithuaniaMalaysiaMexicoMicronesiaMiddle AfricaMoldovaMoroccoNepalNetherlandsNicaraguaNigeriaNorth AmericaNorth MacedoniaNorthern AfricaNorthern EuropeNorwayOceaniaPakistanPanamaPeruPhilippinesPolandPortugalRomaniaRussiaSaudi ArabiaScotlandSenegalSerbiaSierra LeoneSingaporeSomaliaSouth AfricaSouth AmericaSouth Central AsiaSouth Eastern AsiaSouthern EuropeSpainSri LankaSt. Vincent and the GrenadinesSudanSwedenSwitzerlandSyriaTaiwanThailandTrinidad and TobagoTurkeyUgandaUkraineUruguayUzbekistanVenezuelaVietnamWest IndiesWestern AfricaWestern AsiaWestern EuropeYemenZaireZimbabweAzores
Hmong
Race
Ancestry
AfghanAfricanAlaska NativeAlaskan AthabascanAlbanianAleutAlsatianAmericanApacheArabArapahoArgentineanArmenianAssyrian/Chaldean/SyriacAustralianAustrianBahamianBangladeshiBarbadianBasqueBelgianBelizeanBermudanBhutaneseBlackfeetBolivianBrazilianBritishBritish West IndianBulgarianBurmeseCajunCambodianCanadianCape VerdeanCarpatho RusynCelticCentral AmericanCentral American IndianCherokeeCheyenneChickasawChileanChineseChippewaChoctawColombianColvilleComancheCosta RicanCreeCreekCroatianCrowCubanCypriotCzechCzechoslovakianDanishDelawareDominicanDutchDutch West IndianEastern EuropeanEcuadorianEgyptianEnglishEstonianEthiopianEuropeanFijianFilipinoFinnishFrenchFrench American IndianFrench CanadianGermanGerman RussianGhanaianGreekGuamanian/ChamorroGuatemalanGuyaneseHaitianHmongHonduranHopiHoumaHungarianIcelanderIndian (Asian)IndonesianInupiatIranianIraqiIrishIroquoisIsraeliItalianJamaicanJapaneseJordanianKenyanKiowaKoreanLaotianLatvianLebaneseLiberianLithuanianLumbeeLuxembourgerMacedonianMalaysianMalteseMarshalleseMenomineeMexicanMexican American IndianMongolianMoroccanNative HawaiianNavajoNepaleseNew ZealanderNicaraguanNigerianNorthern EuropeanNorwegianOkinawanOsageOttawaPaiutePakistaniPalestinianPanamanianParaguayanPennsylvania GermanPeruvianPimaPolishPortuguesePotawatomiPuebloPuerto RicanPuget Sound SalishRomanianRussianSalvadoranSamoanScandinavianScotch-IrishScottishSeminoleSenegaleseSerbianShoshoneSierra LeoneanSiouxSlavicSlovakSloveneSomaliSouth AfricanSouth AmericanSouth American IndianSoviet UnionSpaniardSpanishSpanish AmericanSpanish American IndianSri LankanSubsaharan AfricanSudaneseSwedishSwissSyrianTaiwaneseThaiTlingit-HaidaTohono O'OdhamTonganTrinidadian and TobagonianTsimshianTurkishU.S. Virgin IslanderUgandanUkrainianUruguayanUteVenezuelanVietnameseWelshWest IndianYakamaYaquiYugoslavianYumanYup'ikZimbabwean
Immigration
NonimmigrantsImmigrantsAfghanistanAfricaAlbaniaArgentinaArmeniaAsiaAustraliaAustriaBahamasBangladeshBarbadosBelarusBelgiumBelizeBoliviaBosnia and HerzegovinaBrazilBulgariaBurma/MyanmarCabo VerdeCambodiaCameroonCanadaCaribbeanCentral AmericaChileChinaColombiaCongoCosta RicaCroatiaCubaCzechoslovakiaDenmarkDominicaDominican RepublicEastern AfricaEastern AsiaEastern EuropeEcuadorEgyptEl SalvadorEnglandEritreaEthiopiaEuropeFijiFranceGermanyGhanaGreeceGrenadaGuatemalaGuyanaHaitiHondurasHong KongHungaryIndiaIndonesiaIranIraqIrelandIsraelItalyJamaicaJapanJordanKazakhstanKenyaKoreaKuwaitLaosLatin AmericaLatviaLebanonLiberiaLithuaniaMalaysiaMexicoMicronesiaMiddle AfricaMoldovaMoroccoNepalNetherlandsNicaraguaNigeriaNorth AmericaNorth MacedoniaNorthern AfricaNorthern EuropeNorwayOceaniaPakistanPanamaPeruPhilippinesPolandPortugalRomaniaRussiaSaudi ArabiaScotlandSenegalSerbiaSierra LeoneSingaporeSomaliaSouth AmericaSouth Central AsiaSouth Eastern AsiaSouthern EuropeSpainSri LankaSt. Vincent and the GrenadinesSudanSwedenSwitzerlandSyriaTaiwanThailandTrinidad and TobagoTurkeyUgandaUkraineUruguayUzbekistanVenezuelaVietnamWest IndiesWestern AfricaWestern AsiaWestern EuropeYemenZaireZimbabweAzores
Married-Couple Family Poverty
Income
Poverty
Unemployment
Labor Participation
Family Structure
Vehicle Availability
Education Level
Disability

Married-Couple Family Poverty Comparison

Immigrants from South Africa

Hmong

Exceptional
Excellent
4.5%
MARRIED-COUPLE FAMILY POVERTY
99.1/ 100
METRIC RATING
76th/ 347
METRIC RANK
5.0%
MARRIED-COUPLE FAMILY POVERTY
83.2/ 100
METRIC RATING
144th/ 347
METRIC RANK

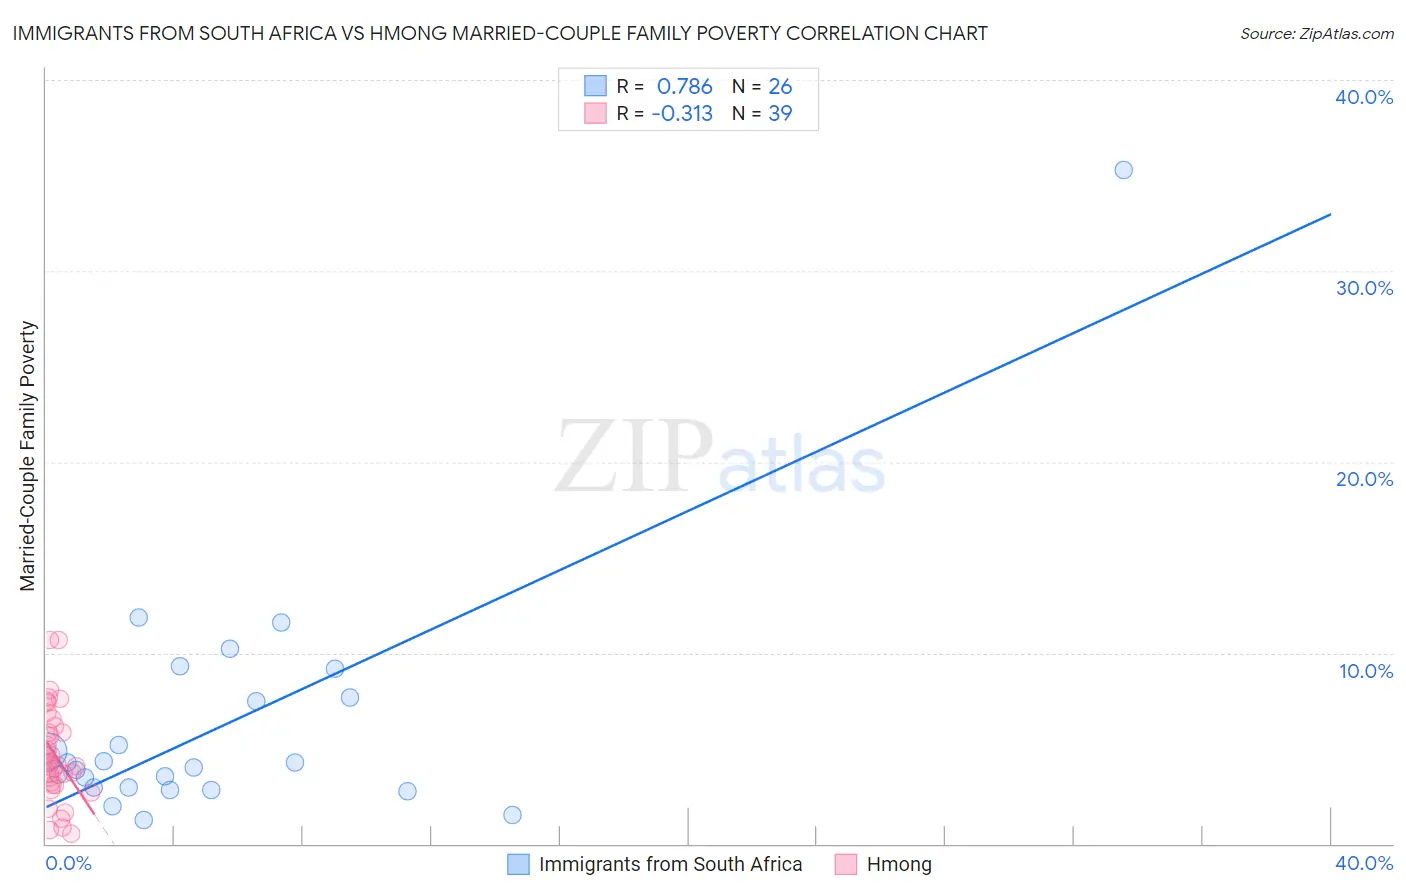
Immigrants from South Africa vs Hmong Married-Couple Family Poverty Correlation Chart

The statistical analysis conducted on geographies consisting of 231,973,185 people shows a strong positive correlation between the proportion of Immigrants from South Africa and poverty level among married-couple families in the United States with a correlation coefficient (R) of 0.786 and weighted average of 4.5%. Similarly, the statistical analysis conducted on geographies consisting of 24,678,157 people shows a mild negative correlation between the proportion of Hmong and poverty level among married-couple families in the United States with a correlation coefficient (R) of -0.313 and weighted average of 5.0%, a difference of 10.5%.
Immigrants from South Africa vs Hmong Married-Couple Family Poverty

Married-Couple Family Poverty Correlation Summary

MeasurementImmigrants from South AfricaHmong
Minimum1.2%0.50%
Maximum35.3%10.7%
Range34.1%10.2%
Mean6.3%4.7%
Median4.1%4.3%
Interquartile 25% (IQ1)2.9%3.1%
Interquartile 75% (IQ3)7.7%6.1%
Interquartile Range (IQR)4.8%3.0%
Standard Deviation (Sample)6.7%2.4%
Standard Deviation (Population)6.5%2.4%

Similar Demographics by Married-Couple Family Poverty

Demographics Similar to Immigrants from South Africa by Married-Couple Family Poverty

In terms of married-couple family poverty, the demographic groups most similar to Immigrants from South Africa are Cambodian (4.5%, a difference of 0.11%), Immigrants from Latvia (4.5%, a difference of 0.17%), Scotch-Irish (4.5%, a difference of 0.25%), Immigrants from Austria (4.5%, a difference of 0.38%), and Ukrainian (4.5%, a difference of 0.48%).
DemographicsRating | RankMarried-Couple Family Poverty
New Zealanders
99.4
/100
|
#69
Exceptional
4.4%
Immigrants | Korea
99.4
/100
|
#70
Exceptional
4.5%
Immigrants | North America
99.3
/100
|
#71
Exceptional
4.5%
Immigrants | England
99.3
/100
|
#72
Exceptional
4.5%
Ukrainians
99.2
/100
|
#73
Exceptional
4.5%
Immigrants | Austria
99.2
/100
|
#74
Exceptional
4.5%
Cambodians
99.2
/100
|
#75
Exceptional
4.5%
Immigrants | South Africa
99.1
/100
|
#76
Exceptional
4.5%
Immigrants | Latvia
99.1
/100
|
#77
Exceptional
4.5%
Scotch-Irish
99.1
/100
|
#78
Exceptional
4.5%
Immigrants | Iran
99.0
/100
|
#79
Exceptional
4.5%
Icelanders
99.0
/100
|
#80
Exceptional
4.5%
Immigrants | Greece
98.9
/100
|
#81
Exceptional
4.5%
Canadians
98.8
/100
|
#82
Exceptional
4.5%
Immigrants | Denmark
98.8
/100
|
#83
Exceptional
4.6%

Demographics Similar to Hmong by Married-Couple Family Poverty

In terms of married-couple family poverty, the demographic groups most similar to Hmong are Immigrants from Egypt (5.0%, a difference of 0.050%), Immigrants from Brazil (5.0%, a difference of 0.32%), Immigrants from China (5.0%, a difference of 0.32%), Immigrants from Portugal (5.0%, a difference of 0.37%), and German Russian (5.0%, a difference of 0.43%).
DemographicsRating | RankMarried-Couple Family Poverty
Guamanians/Chamorros
86.5
/100
|
#137
Excellent
4.9%
Chileans
86.0
/100
|
#138
Excellent
4.9%
German Russians
85.1
/100
|
#139
Excellent
5.0%
Immigrants | Portugal
84.8
/100
|
#140
Excellent
5.0%
Immigrants | Brazil
84.6
/100
|
#141
Excellent
5.0%
Immigrants | China
84.6
/100
|
#142
Excellent
5.0%
Immigrants | Egypt
83.4
/100
|
#143
Excellent
5.0%
Hmong
83.2
/100
|
#144
Excellent
5.0%
Immigrants | Spain
79.9
/100
|
#145
Good
5.0%
Mongolians
79.8
/100
|
#146
Good
5.0%
Syrians
78.7
/100
|
#147
Good
5.0%
Immigrants | Russia
78.7
/100
|
#148
Good
5.0%
Immigrants | Oceania
78.6
/100
|
#149
Good
5.0%
Brazilians
78.3
/100
|
#150
Good
5.0%
Immigrants | Cameroon
77.3
/100
|
#151
Good
5.0%