Immigrants from Scotland vs Polish Family Poverty
COMPARE
Immigrants from Scotland
Polish
Family Poverty
Family Poverty Comparison
Immigrants from Scotland
Poles
7.3%
FAMILY POVERTY
99.6/ 100
METRIC RATING
27th/ 347
METRIC RANK
7.4%
FAMILY POVERTY
99.5/ 100
METRIC RATING
32nd/ 347
METRIC RANK
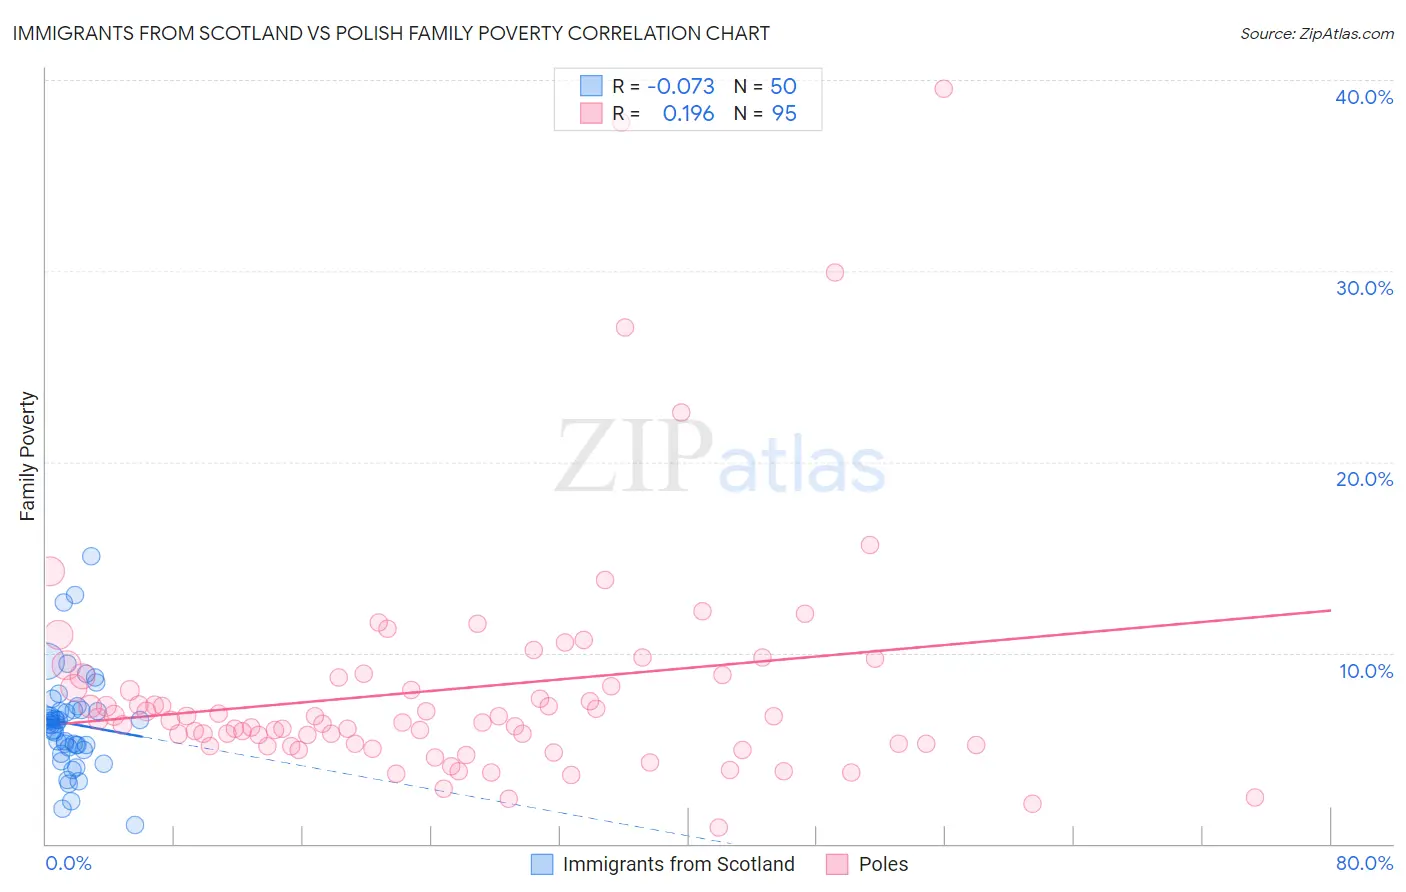
Immigrants from Scotland vs Polish Family Poverty Correlation Chart
The statistical analysis conducted on geographies consisting of 196,152,148 people shows a slight negative correlation between the proportion of Immigrants from Scotland and poverty level among families in the United States with a correlation coefficient (R) of -0.073 and weighted average of 7.3%. Similarly, the statistical analysis conducted on geographies consisting of 555,842,099 people shows a poor positive correlation between the proportion of Poles and poverty level among families in the United States with a correlation coefficient (R) of 0.196 and weighted average of 7.4%, a difference of 1.3%.
Family Poverty Correlation Summary
| Measurement | Immigrants from Scotland | Polish |
| Minimum | 1.00% | 0.85% |
| Maximum | 15.1% | 39.6% |
| Range | 14.1% | 38.7% |
| Mean | 6.3% | 8.1% |
| Median | 6.3% | 6.5% |
| Interquartile 25% (IQ1) | 5.0% | 5.2% |
| Interquartile 75% (IQ3) | 7.0% | 8.8% |
| Interquartile Range (IQR) | 2.0% | 3.6% |
| Standard Deviation (Sample) | 2.6% | 6.3% |
| Standard Deviation (Population) | 2.6% | 6.3% |
Demographics Similar to Immigrants from Scotland and Poles by Family Poverty
In terms of family poverty, the demographic groups most similar to Immigrants from Scotland are Cypriot (7.3%, a difference of 0.020%), Croatian (7.3%, a difference of 0.26%), Burmese (7.3%, a difference of 0.26%), Immigrants from Korea (7.4%, a difference of 0.39%), and Immigrants from Northern Europe (7.4%, a difference of 0.55%). Similarly, the demographic groups most similar to Poles are Immigrants from Japan (7.4%, a difference of 0.0%), Russian (7.5%, a difference of 0.23%), Czech (7.4%, a difference of 0.30%), Italian (7.4%, a difference of 0.42%), and Immigrants from Northern Europe (7.4%, a difference of 0.71%).
| Demographics | Rating | Rank | Family Poverty |
| Eastern Europeans | 99.7 /100 | #19 | Exceptional 7.2% |
| Immigrants | Hong Kong | 99.7 /100 | #20 | Exceptional 7.3% |
| Immigrants | Iran | 99.7 /100 | #21 | Exceptional 7.3% |
| Danes | 99.7 /100 | #22 | Exceptional 7.3% |
| Assyrians/Chaldeans/Syriacs | 99.7 /100 | #23 | Exceptional 7.3% |
| Croatians | 99.7 /100 | #24 | Exceptional 7.3% |
| Burmese | 99.7 /100 | #25 | Exceptional 7.3% |
| Cypriots | 99.6 /100 | #26 | Exceptional 7.3% |
| Immigrants | Scotland | 99.6 /100 | #27 | Exceptional 7.3% |
| Immigrants | Korea | 99.6 /100 | #28 | Exceptional 7.4% |
| Immigrants | Northern Europe | 99.6 /100 | #29 | Exceptional 7.4% |
| Italians | 99.6 /100 | #30 | Exceptional 7.4% |
| Czechs | 99.6 /100 | #31 | Exceptional 7.4% |
| Poles | 99.5 /100 | #32 | Exceptional 7.4% |
| Immigrants | Japan | 99.5 /100 | #33 | Exceptional 7.4% |
| Russians | 99.5 /100 | #34 | Exceptional 7.5% |
| Greeks | 99.4 /100 | #35 | Exceptional 7.5% |
| Turks | 99.4 /100 | #36 | Exceptional 7.5% |
| Estonians | 99.4 /100 | #37 | Exceptional 7.5% |
| Bolivians | 99.3 /100 | #38 | Exceptional 7.5% |
| Carpatho Rusyns | 99.3 /100 | #39 | Exceptional 7.5% |