Immigrants from Scotland vs Immigrants from Thailand Family Poverty
COMPARE
Immigrants from Scotland
Immigrants from Thailand
Family Poverty
Family Poverty Comparison
Immigrants from Scotland
Immigrants from Thailand
7.3%
FAMILY POVERTY
99.6/ 100
METRIC RATING
27th/ 347
METRIC RANK
9.7%
FAMILY POVERTY
9.7/ 100
METRIC RATING
212th/ 347
METRIC RANK
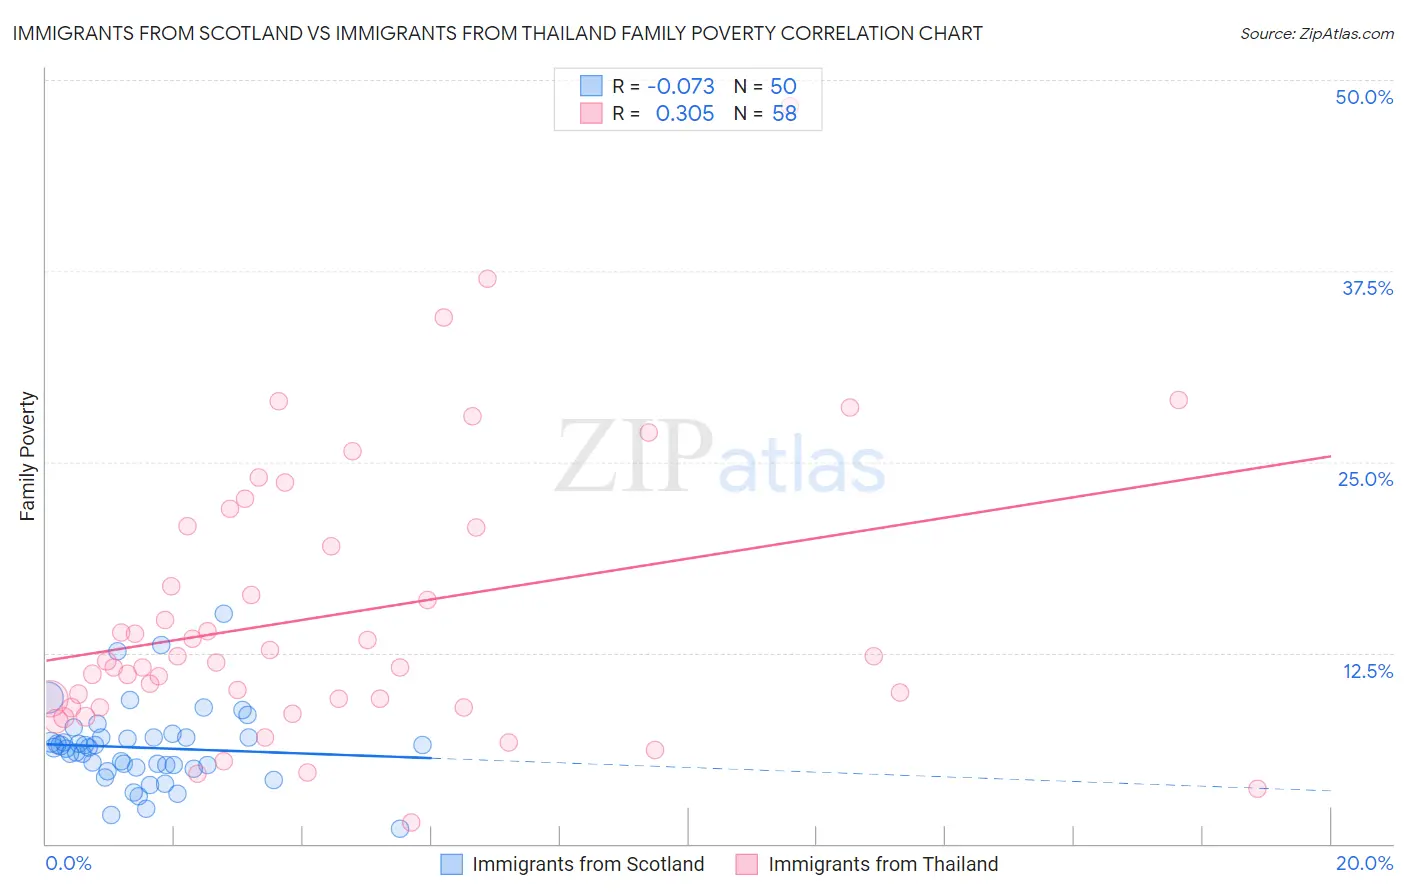
Immigrants from Scotland vs Immigrants from Thailand Family Poverty Correlation Chart
The statistical analysis conducted on geographies consisting of 196,152,148 people shows a slight negative correlation between the proportion of Immigrants from Scotland and poverty level among families in the United States with a correlation coefficient (R) of -0.073 and weighted average of 7.3%. Similarly, the statistical analysis conducted on geographies consisting of 316,654,872 people shows a mild positive correlation between the proportion of Immigrants from Thailand and poverty level among families in the United States with a correlation coefficient (R) of 0.305 and weighted average of 9.7%, a difference of 31.6%.
Family Poverty Correlation Summary
| Measurement | Immigrants from Scotland | Immigrants from Thailand |
| Minimum | 1.00% | 1.4% |
| Maximum | 15.1% | 48.3% |
| Range | 14.1% | 46.9% |
| Mean | 6.3% | 15.0% |
| Median | 6.3% | 11.9% |
| Interquartile 25% (IQ1) | 5.0% | 8.9% |
| Interquartile 75% (IQ3) | 7.0% | 20.7% |
| Interquartile Range (IQR) | 2.0% | 11.8% |
| Standard Deviation (Sample) | 2.6% | 9.2% |
| Standard Deviation (Population) | 2.6% | 9.1% |
Similar Demographics by Family Poverty
Demographics Similar to Immigrants from Scotland by Family Poverty
In terms of family poverty, the demographic groups most similar to Immigrants from Scotland are Cypriot (7.3%, a difference of 0.020%), Croatian (7.3%, a difference of 0.26%), Burmese (7.3%, a difference of 0.26%), Immigrants from Korea (7.4%, a difference of 0.39%), and Immigrants from Northern Europe (7.4%, a difference of 0.55%).
| Demographics | Rating | Rank | Family Poverty |
| Immigrants | Hong Kong | 99.7 /100 | #20 | Exceptional 7.3% |
| Immigrants | Iran | 99.7 /100 | #21 | Exceptional 7.3% |
| Danes | 99.7 /100 | #22 | Exceptional 7.3% |
| Assyrians/Chaldeans/Syriacs | 99.7 /100 | #23 | Exceptional 7.3% |
| Croatians | 99.7 /100 | #24 | Exceptional 7.3% |
| Burmese | 99.7 /100 | #25 | Exceptional 7.3% |
| Cypriots | 99.6 /100 | #26 | Exceptional 7.3% |
| Immigrants | Scotland | 99.6 /100 | #27 | Exceptional 7.3% |
| Immigrants | Korea | 99.6 /100 | #28 | Exceptional 7.4% |
| Immigrants | Northern Europe | 99.6 /100 | #29 | Exceptional 7.4% |
| Italians | 99.6 /100 | #30 | Exceptional 7.4% |
| Czechs | 99.6 /100 | #31 | Exceptional 7.4% |
| Poles | 99.5 /100 | #32 | Exceptional 7.4% |
| Immigrants | Japan | 99.5 /100 | #33 | Exceptional 7.4% |
| Russians | 99.5 /100 | #34 | Exceptional 7.5% |
Demographics Similar to Immigrants from Thailand by Family Poverty
In terms of family poverty, the demographic groups most similar to Immigrants from Thailand are Malaysian (9.6%, a difference of 0.30%), Alsatian (9.6%, a difference of 0.54%), Osage (9.7%, a difference of 0.63%), Immigrants from Micronesia (9.8%, a difference of 1.2%), and Nonimmigrants (9.8%, a difference of 1.2%).
| Demographics | Rating | Rank | Family Poverty |
| Aleuts | 18.0 /100 | #205 | Poor 9.5% |
| Immigrants | South America | 18.0 /100 | #206 | Poor 9.5% |
| Sierra Leoneans | 15.6 /100 | #207 | Poor 9.5% |
| Immigrants | Eastern Africa | 15.1 /100 | #208 | Poor 9.5% |
| Immigrants | Uruguay | 14.0 /100 | #209 | Poor 9.5% |
| Alsatians | 11.3 /100 | #210 | Poor 9.6% |
| Malaysians | 10.6 /100 | #211 | Poor 9.6% |
| Immigrants | Thailand | 9.7 /100 | #212 | Tragic 9.7% |
| Osage | 8.0 /100 | #213 | Tragic 9.7% |
| Immigrants | Micronesia | 6.7 /100 | #214 | Tragic 9.8% |
| Immigrants | Nonimmigrants | 6.7 /100 | #215 | Tragic 9.8% |
| Moroccans | 6.5 /100 | #216 | Tragic 9.8% |
| Americans | 6.2 /100 | #217 | Tragic 9.8% |
| Panamanians | 5.6 /100 | #218 | Tragic 9.8% |
| Immigrants | Eritrea | 5.4 /100 | #219 | Tragic 9.9% |