Swiss vs Polish Family Poverty
COMPARE
Swiss
Polish
Family Poverty
Family Poverty Comparison
Swiss
Poles
7.7%
FAMILY POVERTY
98.8/ 100
METRIC RATING
53rd/ 347
METRIC RANK
7.4%
FAMILY POVERTY
99.5/ 100
METRIC RATING
32nd/ 347
METRIC RANK
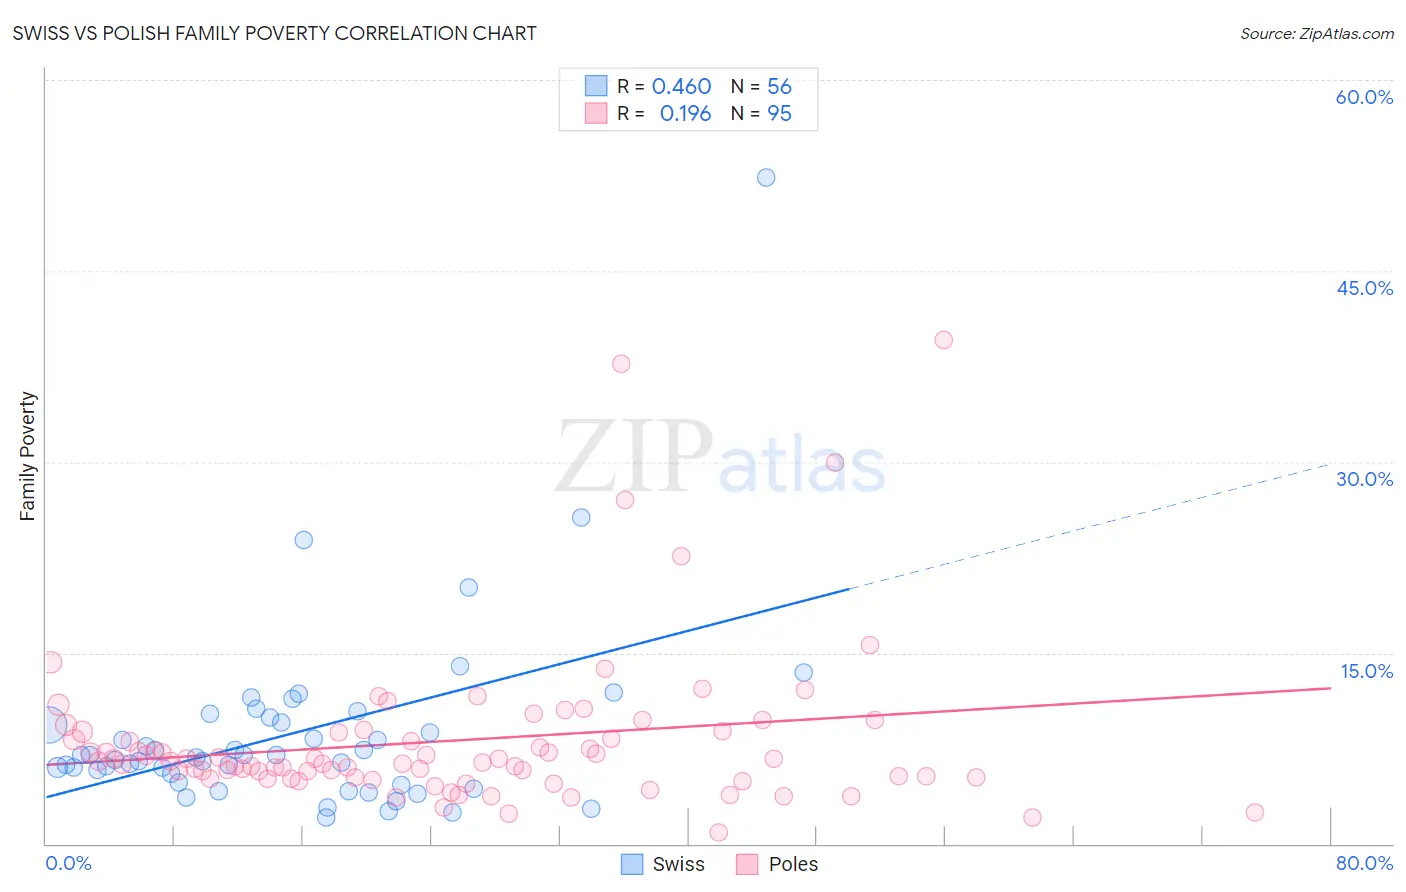
Swiss vs Polish Family Poverty Correlation Chart
The statistical analysis conducted on geographies consisting of 462,917,875 people shows a moderate positive correlation between the proportion of Swiss and poverty level among families in the United States with a correlation coefficient (R) of 0.460 and weighted average of 7.7%. Similarly, the statistical analysis conducted on geographies consisting of 555,842,099 people shows a poor positive correlation between the proportion of Poles and poverty level among families in the United States with a correlation coefficient (R) of 0.196 and weighted average of 7.4%, a difference of 3.8%.
Family Poverty Correlation Summary
| Measurement | Swiss | Polish |
| Minimum | 2.1% | 0.85% |
| Maximum | 52.4% | 39.6% |
| Range | 50.3% | 38.7% |
| Mean | 8.6% | 8.1% |
| Median | 6.9% | 6.5% |
| Interquartile 25% (IQ1) | 5.1% | 5.2% |
| Interquartile 75% (IQ3) | 9.7% | 8.8% |
| Interquartile Range (IQR) | 4.6% | 3.6% |
| Standard Deviation (Sample) | 7.6% | 6.3% |
| Standard Deviation (Population) | 7.5% | 6.3% |
Similar Demographics by Family Poverty
Demographics Similar to Swiss by Family Poverty
In terms of family poverty, the demographic groups most similar to Swiss are Immigrants from Sweden (7.7%, a difference of 0.010%), Immigrants from Eastern Asia (7.7%, a difference of 0.040%), Indian (Asian) (7.7%, a difference of 0.060%), Immigrants from Serbia (7.7%, a difference of 0.080%), and Asian (7.7%, a difference of 0.17%).
| Demographics | Rating | Rank | Family Poverty |
| Tongans | 98.9 /100 | #46 | Exceptional 7.7% |
| Immigrants | Czechoslovakia | 98.9 /100 | #47 | Exceptional 7.7% |
| Immigrants | Sri Lanka | 98.9 /100 | #48 | Exceptional 7.7% |
| Immigrants | Bolivia | 98.9 /100 | #49 | Exceptional 7.7% |
| Immigrants | North Macedonia | 98.9 /100 | #50 | Exceptional 7.7% |
| Immigrants | Moldova | 98.8 /100 | #51 | Exceptional 7.7% |
| Indians (Asian) | 98.8 /100 | #52 | Exceptional 7.7% |
| Swiss | 98.8 /100 | #53 | Exceptional 7.7% |
| Immigrants | Sweden | 98.8 /100 | #54 | Exceptional 7.7% |
| Immigrants | Eastern Asia | 98.7 /100 | #55 | Exceptional 7.7% |
| Immigrants | Serbia | 98.7 /100 | #56 | Exceptional 7.7% |
| Asians | 98.7 /100 | #57 | Exceptional 7.7% |
| Finns | 98.7 /100 | #58 | Exceptional 7.7% |
| Europeans | 98.7 /100 | #59 | Exceptional 7.7% |
| Immigrants | Greece | 98.7 /100 | #60 | Exceptional 7.7% |
Demographics Similar to Poles by Family Poverty
In terms of family poverty, the demographic groups most similar to Poles are Immigrants from Japan (7.4%, a difference of 0.0%), Russian (7.5%, a difference of 0.23%), Czech (7.4%, a difference of 0.30%), Italian (7.4%, a difference of 0.42%), and Immigrants from Northern Europe (7.4%, a difference of 0.71%).
| Demographics | Rating | Rank | Family Poverty |
| Burmese | 99.7 /100 | #25 | Exceptional 7.3% |
| Cypriots | 99.6 /100 | #26 | Exceptional 7.3% |
| Immigrants | Scotland | 99.6 /100 | #27 | Exceptional 7.3% |
| Immigrants | Korea | 99.6 /100 | #28 | Exceptional 7.4% |
| Immigrants | Northern Europe | 99.6 /100 | #29 | Exceptional 7.4% |
| Italians | 99.6 /100 | #30 | Exceptional 7.4% |
| Czechs | 99.6 /100 | #31 | Exceptional 7.4% |
| Poles | 99.5 /100 | #32 | Exceptional 7.4% |
| Immigrants | Japan | 99.5 /100 | #33 | Exceptional 7.4% |
| Russians | 99.5 /100 | #34 | Exceptional 7.5% |
| Greeks | 99.4 /100 | #35 | Exceptional 7.5% |
| Turks | 99.4 /100 | #36 | Exceptional 7.5% |
| Estonians | 99.4 /100 | #37 | Exceptional 7.5% |
| Bolivians | 99.3 /100 | #38 | Exceptional 7.5% |
| Carpatho Rusyns | 99.3 /100 | #39 | Exceptional 7.5% |