Immigrants from Ecuador vs Navajo Married-Couple Family Poverty
COMPARE
Immigrants from Ecuador
Navajo
Married-Couple Family Poverty
Married-Couple Family Poverty Comparison
Immigrants from Ecuador
Navajo
6.7%
MARRIED-COUPLE FAMILY POVERTY
0.0/ 100
METRIC RATING
302nd/ 347
METRIC RANK
11.9%
MARRIED-COUPLE FAMILY POVERTY
0.0/ 100
METRIC RATING
344th/ 347
METRIC RANK
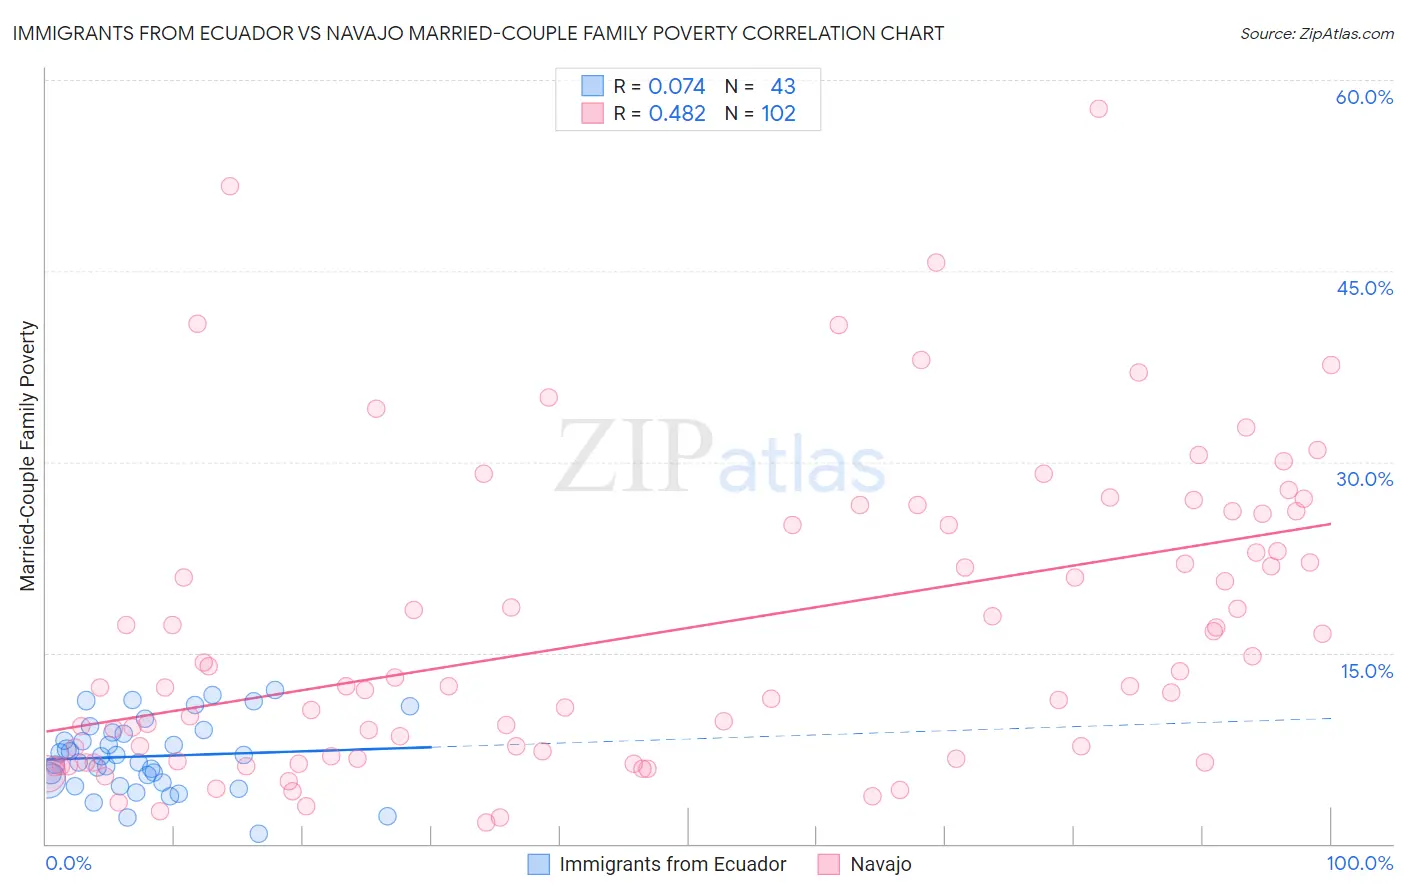
Immigrants from Ecuador vs Navajo Married-Couple Family Poverty Correlation Chart
The statistical analysis conducted on geographies consisting of 269,492,942 people shows a slight positive correlation between the proportion of Immigrants from Ecuador and poverty level among married-couple families in the United States with a correlation coefficient (R) of 0.074 and weighted average of 6.7%. Similarly, the statistical analysis conducted on geographies consisting of 223,988,346 people shows a moderate positive correlation between the proportion of Navajo and poverty level among married-couple families in the United States with a correlation coefficient (R) of 0.482 and weighted average of 11.9%, a difference of 75.6%.
Married-Couple Family Poverty Correlation Summary
| Measurement | Immigrants from Ecuador | Navajo |
| Minimum | 0.76% | 1.7% |
| Maximum | 12.1% | 57.8% |
| Range | 11.3% | 56.1% |
| Mean | 6.9% | 16.7% |
| Median | 6.9% | 12.4% |
| Interquartile 25% (IQ1) | 4.8% | 6.7% |
| Interquartile 75% (IQ3) | 8.8% | 25.0% |
| Interquartile Range (IQR) | 3.9% | 18.3% |
| Standard Deviation (Sample) | 2.8% | 11.8% |
| Standard Deviation (Population) | 2.8% | 11.8% |
Similar Demographics by Married-Couple Family Poverty
Demographics Similar to Immigrants from Ecuador by Married-Couple Family Poverty
In terms of married-couple family poverty, the demographic groups most similar to Immigrants from Ecuador are Central American (6.7%, a difference of 0.14%), Immigrants from El Salvador (6.8%, a difference of 0.28%), Cuban (6.8%, a difference of 0.72%), Immigrants from Belize (6.7%, a difference of 0.74%), and Haitian (6.8%, a difference of 0.83%).
| Demographics | Rating | Rank | Married-Couple Family Poverty |
| Immigrants | Uzbekistan | 0.0 /100 | #295 | Tragic 6.6% |
| U.S. Virgin Islanders | 0.0 /100 | #296 | Tragic 6.6% |
| Kiowa | 0.0 /100 | #297 | Tragic 6.6% |
| Immigrants | Guyana | 0.0 /100 | #298 | Tragic 6.7% |
| Nicaraguans | 0.0 /100 | #299 | Tragic 6.7% |
| Immigrants | Belize | 0.0 /100 | #300 | Tragic 6.7% |
| Central Americans | 0.0 /100 | #301 | Tragic 6.7% |
| Immigrants | Ecuador | 0.0 /100 | #302 | Tragic 6.7% |
| Immigrants | El Salvador | 0.0 /100 | #303 | Tragic 6.8% |
| Cubans | 0.0 /100 | #304 | Tragic 6.8% |
| Haitians | 0.0 /100 | #305 | Tragic 6.8% |
| Immigrants | Haiti | 0.0 /100 | #306 | Tragic 7.0% |
| Guatemalans | 0.0 /100 | #307 | Tragic 7.0% |
| Spanish American Indians | 0.0 /100 | #308 | Tragic 7.1% |
| Hopi | 0.0 /100 | #309 | Tragic 7.1% |
Demographics Similar to Navajo by Married-Couple Family Poverty
In terms of married-couple family poverty, the demographic groups most similar to Navajo are Pima (11.4%, a difference of 3.9%), Tohono O'odham (11.2%, a difference of 5.6%), Puerto Rican (12.6%, a difference of 6.6%), Pueblo (11.1%, a difference of 6.6%), and Immigrants from Yemen (12.8%, a difference of 8.0%).
| Demographics | Rating | Rank | Married-Couple Family Poverty |
| Lumbee | 0.0 /100 | #333 | Tragic 8.3% |
| Immigrants | Dominican Republic | 0.0 /100 | #334 | Tragic 8.4% |
| Sioux | 0.0 /100 | #335 | Tragic 8.7% |
| Apache | 0.0 /100 | #336 | Tragic 9.0% |
| Yakama | 0.0 /100 | #337 | Tragic 9.0% |
| Cheyenne | 0.0 /100 | #338 | Tragic 9.4% |
| Crow | 0.0 /100 | #339 | Tragic 9.6% |
| Yuman | 0.0 /100 | #340 | Tragic 9.7% |
| Pueblo | 0.0 /100 | #341 | Tragic 11.1% |
| Tohono O'odham | 0.0 /100 | #342 | Tragic 11.2% |
| Pima | 0.0 /100 | #343 | Tragic 11.4% |
| Navajo | 0.0 /100 | #344 | Tragic 11.9% |
| Puerto Ricans | 0.0 /100 | #345 | Tragic 12.6% |
| Immigrants | Yemen | 0.0 /100 | #346 | Tragic 12.8% |
| Yup'ik | 0.0 /100 | #347 | Tragic 13.4% |