Immigrants from Cuba vs Chilean Poverty
COMPARE
Immigrants from Cuba
Chilean
Poverty
Poverty Comparison
Immigrants from Cuba
Chileans
14.6%
POVERTY
0.1/ 100
METRIC RATING
269th/ 347
METRIC RANK
11.8%
POVERTY
84.2/ 100
METRIC RATING
136th/ 347
METRIC RANK
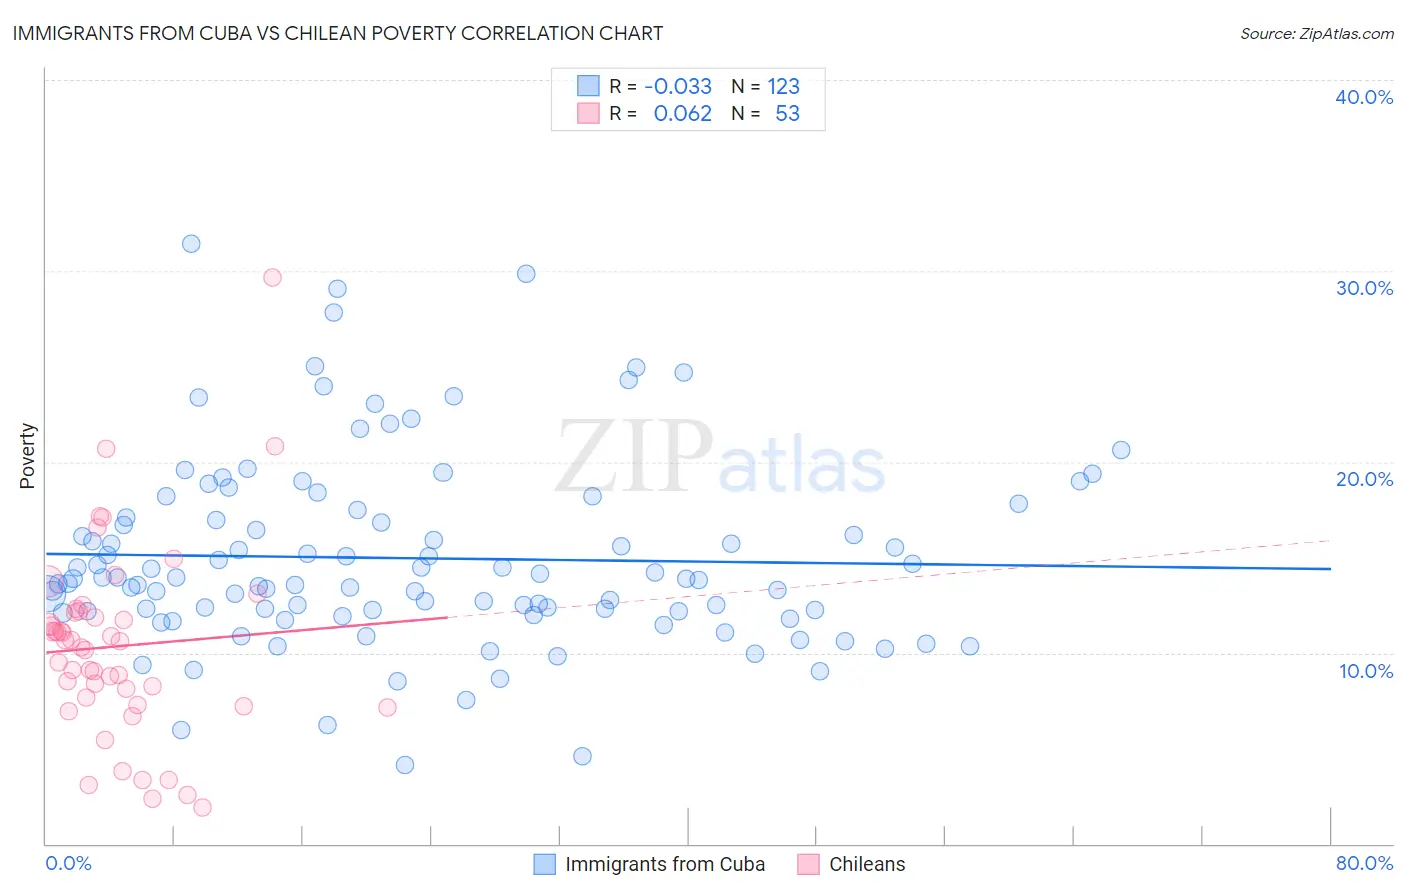
Immigrants from Cuba vs Chilean Poverty Correlation Chart
The statistical analysis conducted on geographies consisting of 325,967,480 people shows no correlation between the proportion of Immigrants from Cuba and poverty level in the United States with a correlation coefficient (R) of -0.033 and weighted average of 14.6%. Similarly, the statistical analysis conducted on geographies consisting of 256,580,078 people shows a slight positive correlation between the proportion of Chileans and poverty level in the United States with a correlation coefficient (R) of 0.062 and weighted average of 11.8%, a difference of 23.2%.
Poverty Correlation Summary
| Measurement | Immigrants from Cuba | Chilean |
| Minimum | 4.1% | 1.9% |
| Maximum | 31.4% | 29.7% |
| Range | 27.3% | 27.8% |
| Mean | 15.0% | 10.3% |
| Median | 13.9% | 10.6% |
| Interquartile 25% (IQ1) | 12.2% | 7.5% |
| Interquartile 75% (IQ3) | 17.1% | 12.1% |
| Interquartile Range (IQR) | 4.9% | 4.7% |
| Standard Deviation (Sample) | 5.0% | 5.0% |
| Standard Deviation (Population) | 5.0% | 5.0% |
Similar Demographics by Poverty
Demographics Similar to Immigrants from Cuba by Poverty
In terms of poverty, the demographic groups most similar to Immigrants from Cuba are Central American (14.6%, a difference of 0.14%), Subsaharan African (14.5%, a difference of 0.15%), Iroquois (14.5%, a difference of 0.19%), Guyanese (14.5%, a difference of 0.51%), and Immigrants from Guyana (14.5%, a difference of 0.68%).
| Demographics | Rating | Rank | Poverty |
| Immigrants | Liberia | 0.1 /100 | #262 | Tragic 14.4% |
| Jamaicans | 0.1 /100 | #263 | Tragic 14.4% |
| Immigrants | Jamaica | 0.1 /100 | #264 | Tragic 14.4% |
| Immigrants | Guyana | 0.1 /100 | #265 | Tragic 14.5% |
| Guyanese | 0.1 /100 | #266 | Tragic 14.5% |
| Iroquois | 0.1 /100 | #267 | Tragic 14.5% |
| Sub-Saharan Africans | 0.1 /100 | #268 | Tragic 14.5% |
| Immigrants | Cuba | 0.1 /100 | #269 | Tragic 14.6% |
| Central Americans | 0.1 /100 | #270 | Tragic 14.6% |
| Shoshone | 0.0 /100 | #271 | Tragic 14.7% |
| Chickasaw | 0.0 /100 | #272 | Tragic 14.7% |
| Spanish Americans | 0.0 /100 | #273 | Tragic 14.7% |
| Barbadians | 0.0 /100 | #274 | Tragic 14.8% |
| Immigrants | West Indies | 0.0 /100 | #275 | Tragic 14.8% |
| Immigrants | Bahamas | 0.0 /100 | #276 | Tragic 14.8% |
Demographics Similar to Chileans by Poverty
In terms of poverty, the demographic groups most similar to Chileans are Immigrants from Vietnam (11.8%, a difference of 0.19%), Yugoslavian (11.8%, a difference of 0.20%), Immigrants from Western Europe (11.8%, a difference of 0.21%), Immigrants from Switzerland (11.8%, a difference of 0.21%), and Peruvian (11.8%, a difference of 0.29%).
| Demographics | Rating | Rank | Poverty |
| South Africans | 87.0 /100 | #129 | Excellent 11.7% |
| Immigrants | Ukraine | 86.6 /100 | #130 | Excellent 11.8% |
| French | 86.1 /100 | #131 | Excellent 11.8% |
| Peruvians | 85.6 /100 | #132 | Excellent 11.8% |
| Immigrants | Western Europe | 85.2 /100 | #133 | Excellent 11.8% |
| Yugoslavians | 85.2 /100 | #134 | Excellent 11.8% |
| Immigrants | Vietnam | 85.2 /100 | #135 | Excellent 11.8% |
| Chileans | 84.2 /100 | #136 | Excellent 11.8% |
| Immigrants | Switzerland | 83.0 /100 | #137 | Excellent 11.8% |
| Immigrants | Jordan | 82.4 /100 | #138 | Excellent 11.9% |
| Pakistanis | 82.2 /100 | #139 | Excellent 11.9% |
| Immigrants | Peru | 81.1 /100 | #140 | Excellent 11.9% |
| Immigrants | France | 80.5 /100 | #141 | Excellent 11.9% |
| Basques | 80.4 /100 | #142 | Excellent 11.9% |
| Brazilians | 79.7 /100 | #143 | Good 11.9% |