Korean vs Chilean Poverty
COMPARE
Korean
Chilean
Poverty
Poverty Comparison
Koreans
Chileans
10.9%
POVERTY
99.2/ 100
METRIC RATING
42nd/ 347
METRIC RANK
11.8%
POVERTY
84.2/ 100
METRIC RATING
136th/ 347
METRIC RANK
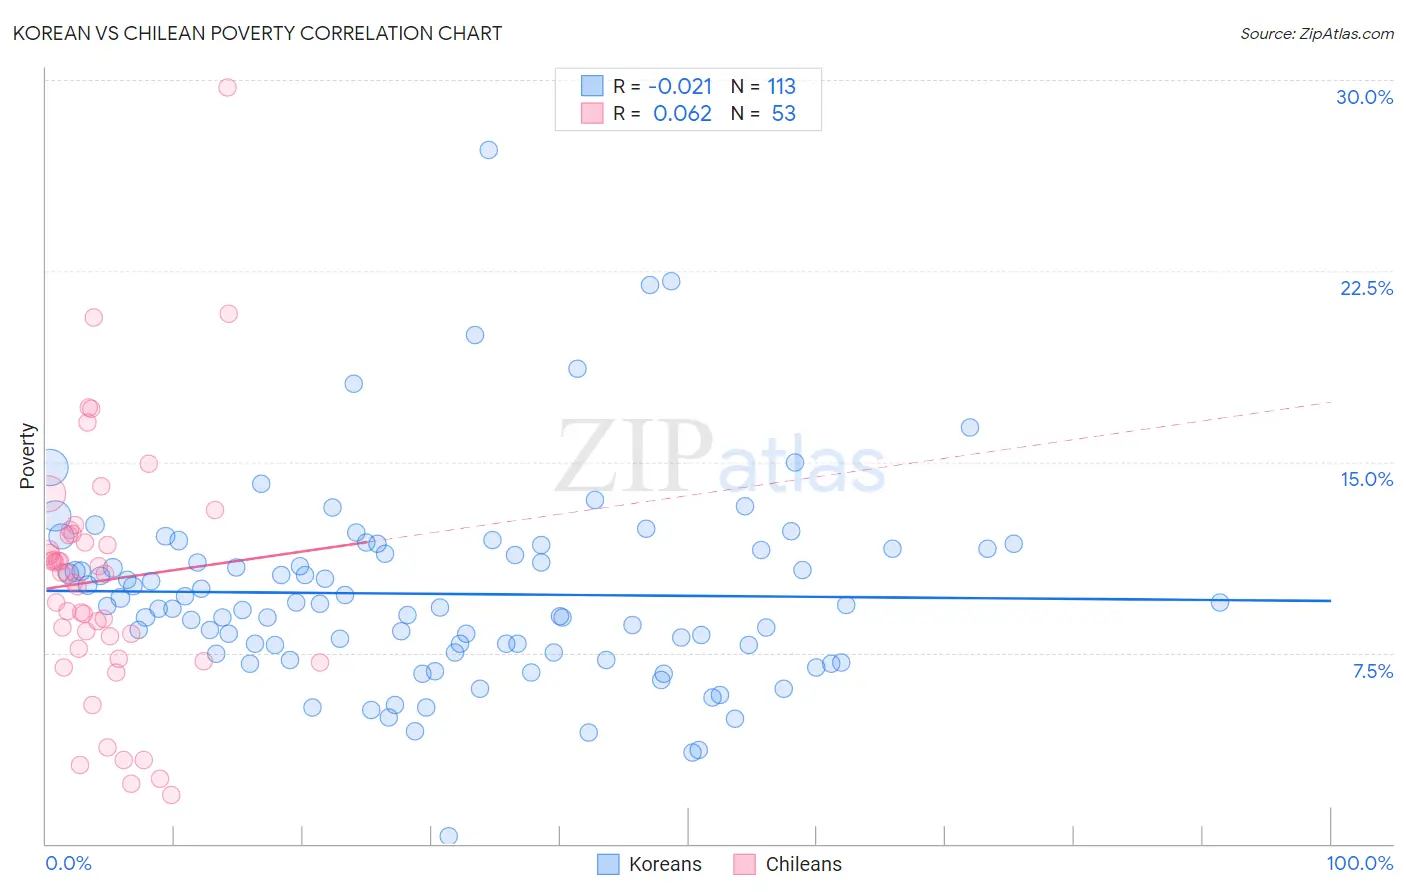
Korean vs Chilean Poverty Correlation Chart
The statistical analysis conducted on geographies consisting of 510,388,718 people shows no correlation between the proportion of Koreans and poverty level in the United States with a correlation coefficient (R) of -0.021 and weighted average of 10.9%. Similarly, the statistical analysis conducted on geographies consisting of 256,580,078 people shows a slight positive correlation between the proportion of Chileans and poverty level in the United States with a correlation coefficient (R) of 0.062 and weighted average of 11.8%, a difference of 8.6%.
Poverty Correlation Summary
| Measurement | Korean | Chilean |
| Minimum | 0.27% | 1.9% |
| Maximum | 27.2% | 29.7% |
| Range | 27.0% | 27.8% |
| Mean | 9.8% | 10.3% |
| Median | 9.3% | 10.6% |
| Interquartile 25% (IQ1) | 7.5% | 7.5% |
| Interquartile 75% (IQ3) | 11.6% | 12.1% |
| Interquartile Range (IQR) | 4.0% | 4.7% |
| Standard Deviation (Sample) | 3.9% | 5.0% |
| Standard Deviation (Population) | 3.8% | 5.0% |
Similar Demographics by Poverty
Demographics Similar to Koreans by Poverty
In terms of poverty, the demographic groups most similar to Koreans are Immigrants from Singapore (10.9%, a difference of 0.050%), Immigrants from Moldova (10.9%, a difference of 0.19%), Immigrants from Iran (10.9%, a difference of 0.22%), Russian (10.9%, a difference of 0.31%), and Immigrants from Pakistan (10.8%, a difference of 0.36%).
| Demographics | Rating | Rank | Poverty |
| Tongans | 99.4 /100 | #35 | Exceptional 10.8% |
| Cypriots | 99.3 /100 | #36 | Exceptional 10.8% |
| Immigrants | Greece | 99.3 /100 | #37 | Exceptional 10.8% |
| Czechs | 99.3 /100 | #38 | Exceptional 10.8% |
| Immigrants | Pakistan | 99.3 /100 | #39 | Exceptional 10.8% |
| Russians | 99.3 /100 | #40 | Exceptional 10.9% |
| Immigrants | Iran | 99.2 /100 | #41 | Exceptional 10.9% |
| Koreans | 99.2 /100 | #42 | Exceptional 10.9% |
| Immigrants | Singapore | 99.2 /100 | #43 | Exceptional 10.9% |
| Immigrants | Moldova | 99.1 /100 | #44 | Exceptional 10.9% |
| Turks | 98.9 /100 | #45 | Exceptional 11.0% |
| Immigrants | Czechoslovakia | 98.9 /100 | #46 | Exceptional 11.0% |
| Immigrants | Romania | 98.9 /100 | #47 | Exceptional 11.0% |
| Slovenes | 98.9 /100 | #48 | Exceptional 11.0% |
| Immigrants | Japan | 98.9 /100 | #49 | Exceptional 11.0% |
Demographics Similar to Chileans by Poverty
In terms of poverty, the demographic groups most similar to Chileans are Immigrants from Vietnam (11.8%, a difference of 0.19%), Yugoslavian (11.8%, a difference of 0.20%), Immigrants from Western Europe (11.8%, a difference of 0.21%), Immigrants from Switzerland (11.8%, a difference of 0.21%), and Peruvian (11.8%, a difference of 0.29%).
| Demographics | Rating | Rank | Poverty |
| South Africans | 87.0 /100 | #129 | Excellent 11.7% |
| Immigrants | Ukraine | 86.6 /100 | #130 | Excellent 11.8% |
| French | 86.1 /100 | #131 | Excellent 11.8% |
| Peruvians | 85.6 /100 | #132 | Excellent 11.8% |
| Immigrants | Western Europe | 85.2 /100 | #133 | Excellent 11.8% |
| Yugoslavians | 85.2 /100 | #134 | Excellent 11.8% |
| Immigrants | Vietnam | 85.2 /100 | #135 | Excellent 11.8% |
| Chileans | 84.2 /100 | #136 | Excellent 11.8% |
| Immigrants | Switzerland | 83.0 /100 | #137 | Excellent 11.8% |
| Immigrants | Jordan | 82.4 /100 | #138 | Excellent 11.9% |
| Pakistanis | 82.2 /100 | #139 | Excellent 11.9% |
| Immigrants | Peru | 81.1 /100 | #140 | Excellent 11.9% |
| Immigrants | France | 80.5 /100 | #141 | Excellent 11.9% |
| Basques | 80.4 /100 | #142 | Excellent 11.9% |
| Brazilians | 79.7 /100 | #143 | Good 11.9% |