Immigrants from Cuba vs Tlingit-Haida Poverty
COMPARE
Immigrants from Cuba
Tlingit-Haida
Poverty
Poverty Comparison
Immigrants from Cuba
Tlingit-Haida
14.6%
POVERTY
0.1/ 100
METRIC RATING
269th/ 347
METRIC RANK
11.7%
POVERTY
89.0/ 100
METRIC RATING
119th/ 347
METRIC RANK
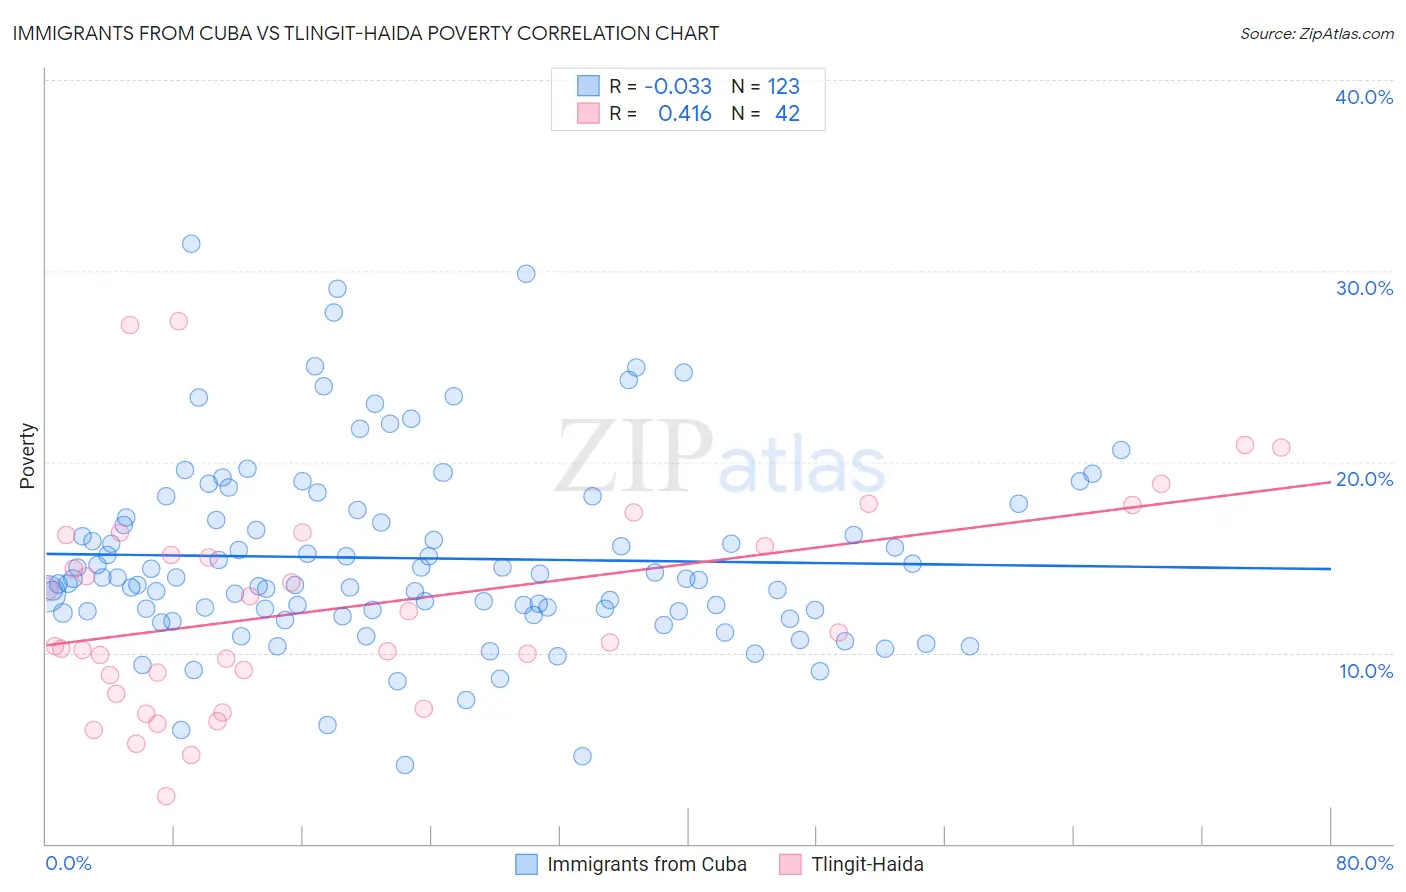
Immigrants from Cuba vs Tlingit-Haida Poverty Correlation Chart
The statistical analysis conducted on geographies consisting of 325,967,480 people shows no correlation between the proportion of Immigrants from Cuba and poverty level in the United States with a correlation coefficient (R) of -0.033 and weighted average of 14.6%. Similarly, the statistical analysis conducted on geographies consisting of 60,855,126 people shows a moderate positive correlation between the proportion of Tlingit-Haida and poverty level in the United States with a correlation coefficient (R) of 0.416 and weighted average of 11.7%, a difference of 24.5%.
Poverty Correlation Summary
| Measurement | Immigrants from Cuba | Tlingit-Haida |
| Minimum | 4.1% | 2.5% |
| Maximum | 31.4% | 27.4% |
| Range | 27.3% | 24.9% |
| Mean | 15.0% | 12.4% |
| Median | 13.9% | 10.8% |
| Interquartile 25% (IQ1) | 12.2% | 8.9% |
| Interquartile 75% (IQ3) | 17.1% | 16.2% |
| Interquartile Range (IQR) | 4.9% | 7.3% |
| Standard Deviation (Sample) | 5.0% | 5.6% |
| Standard Deviation (Population) | 5.0% | 5.6% |
Similar Demographics by Poverty
Demographics Similar to Immigrants from Cuba by Poverty
In terms of poverty, the demographic groups most similar to Immigrants from Cuba are Central American (14.6%, a difference of 0.14%), Subsaharan African (14.5%, a difference of 0.15%), Iroquois (14.5%, a difference of 0.19%), Guyanese (14.5%, a difference of 0.51%), and Immigrants from Guyana (14.5%, a difference of 0.68%).
| Demographics | Rating | Rank | Poverty |
| Immigrants | Liberia | 0.1 /100 | #262 | Tragic 14.4% |
| Jamaicans | 0.1 /100 | #263 | Tragic 14.4% |
| Immigrants | Jamaica | 0.1 /100 | #264 | Tragic 14.4% |
| Immigrants | Guyana | 0.1 /100 | #265 | Tragic 14.5% |
| Guyanese | 0.1 /100 | #266 | Tragic 14.5% |
| Iroquois | 0.1 /100 | #267 | Tragic 14.5% |
| Sub-Saharan Africans | 0.1 /100 | #268 | Tragic 14.5% |
| Immigrants | Cuba | 0.1 /100 | #269 | Tragic 14.6% |
| Central Americans | 0.1 /100 | #270 | Tragic 14.6% |
| Shoshone | 0.0 /100 | #271 | Tragic 14.7% |
| Chickasaw | 0.0 /100 | #272 | Tragic 14.7% |
| Spanish Americans | 0.0 /100 | #273 | Tragic 14.7% |
| Barbadians | 0.0 /100 | #274 | Tragic 14.8% |
| Immigrants | West Indies | 0.0 /100 | #275 | Tragic 14.8% |
| Immigrants | Bahamas | 0.0 /100 | #276 | Tragic 14.8% |
Demographics Similar to Tlingit-Haida by Poverty
In terms of poverty, the demographic groups most similar to Tlingit-Haida are Immigrants from South Eastern Asia (11.7%, a difference of 0.010%), Argentinean (11.7%, a difference of 0.040%), New Zealander (11.7%, a difference of 0.070%), Puget Sound Salish (11.7%, a difference of 0.070%), and Immigrants from Hungary (11.7%, a difference of 0.090%).
| Demographics | Rating | Rank | Poverty |
| Immigrants | Southern Europe | 90.8 /100 | #112 | Exceptional 11.6% |
| Immigrants | Belarus | 90.8 /100 | #113 | Exceptional 11.6% |
| Immigrants | China | 90.7 /100 | #114 | Exceptional 11.6% |
| Albanians | 90.3 /100 | #115 | Exceptional 11.7% |
| Immigrants | Russia | 89.7 /100 | #116 | Excellent 11.7% |
| Sri Lankans | 89.4 /100 | #117 | Excellent 11.7% |
| Argentineans | 89.1 /100 | #118 | Excellent 11.7% |
| Tlingit-Haida | 89.0 /100 | #119 | Excellent 11.7% |
| Immigrants | South Eastern Asia | 88.9 /100 | #120 | Excellent 11.7% |
| New Zealanders | 88.7 /100 | #121 | Excellent 11.7% |
| Puget Sound Salish | 88.7 /100 | #122 | Excellent 11.7% |
| Immigrants | Hungary | 88.6 /100 | #123 | Excellent 11.7% |
| Soviet Union | 88.4 /100 | #124 | Excellent 11.7% |
| Immigrants | Brazil | 88.2 /100 | #125 | Excellent 11.7% |
| Immigrants | Norway | 88.0 /100 | #126 | Excellent 11.7% |