Immigrants from Cuba vs Ugandan Poverty
COMPARE
Immigrants from Cuba
Ugandan
Poverty
Poverty Comparison
Immigrants from Cuba
Ugandans
14.6%
POVERTY
0.1/ 100
METRIC RATING
269th/ 347
METRIC RANK
13.1%
POVERTY
6.2/ 100
METRIC RATING
208th/ 347
METRIC RANK
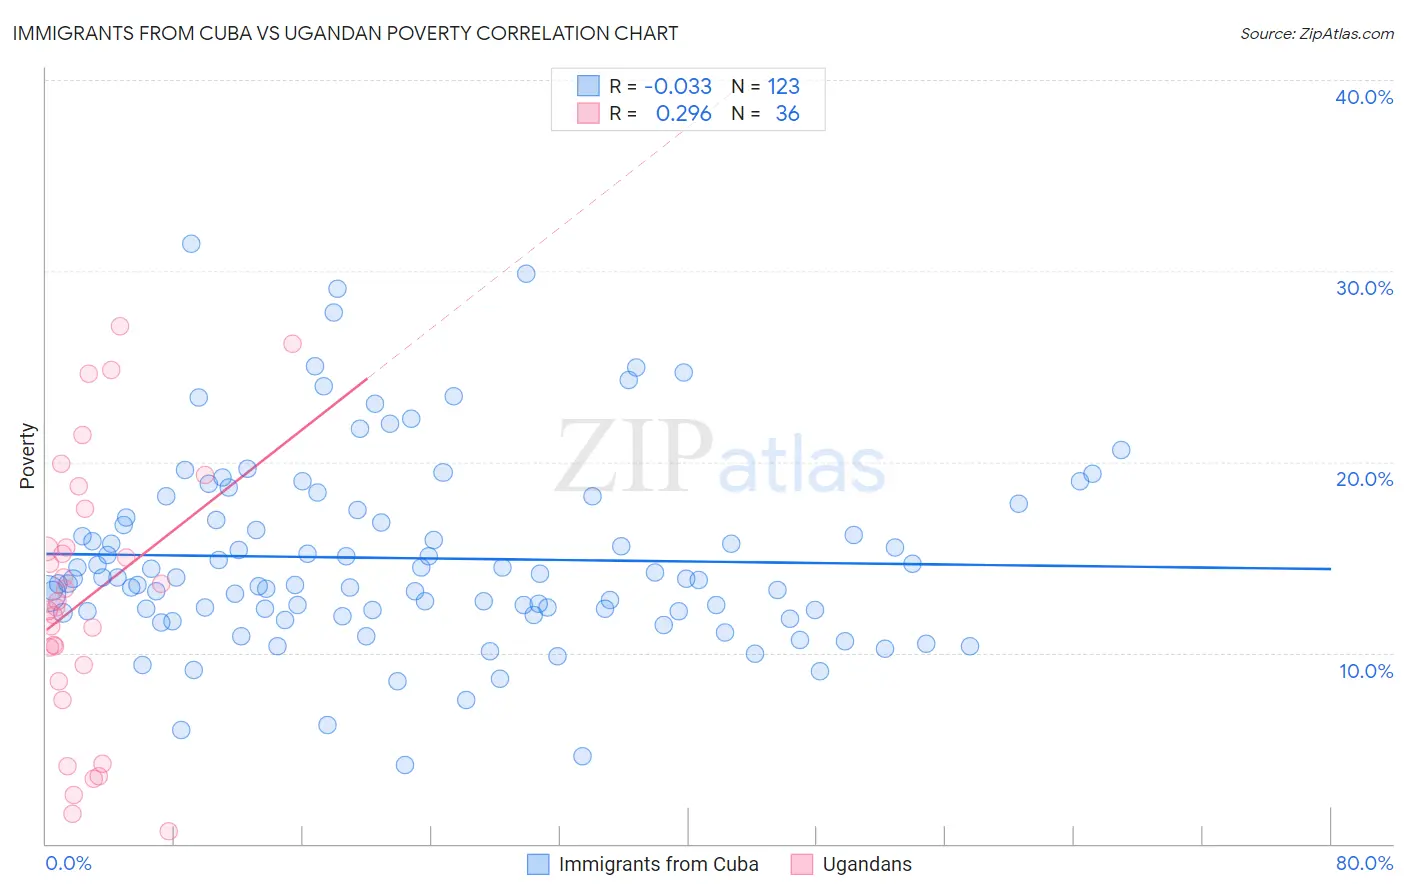
Immigrants from Cuba vs Ugandan Poverty Correlation Chart
The statistical analysis conducted on geographies consisting of 325,967,480 people shows no correlation between the proportion of Immigrants from Cuba and poverty level in the United States with a correlation coefficient (R) of -0.033 and weighted average of 14.6%. Similarly, the statistical analysis conducted on geographies consisting of 93,996,476 people shows a weak positive correlation between the proportion of Ugandans and poverty level in the United States with a correlation coefficient (R) of 0.296 and weighted average of 13.1%, a difference of 10.9%.
Poverty Correlation Summary
| Measurement | Immigrants from Cuba | Ugandan |
| Minimum | 4.1% | 0.63% |
| Maximum | 31.4% | 27.1% |
| Range | 27.3% | 26.5% |
| Mean | 15.0% | 12.9% |
| Median | 13.9% | 12.5% |
| Interquartile 25% (IQ1) | 12.2% | 8.9% |
| Interquartile 75% (IQ3) | 17.1% | 16.5% |
| Interquartile Range (IQR) | 4.9% | 7.6% |
| Standard Deviation (Sample) | 5.0% | 7.0% |
| Standard Deviation (Population) | 5.0% | 6.9% |
Similar Demographics by Poverty
Demographics Similar to Immigrants from Cuba by Poverty
In terms of poverty, the demographic groups most similar to Immigrants from Cuba are Central American (14.6%, a difference of 0.14%), Subsaharan African (14.5%, a difference of 0.15%), Iroquois (14.5%, a difference of 0.19%), Guyanese (14.5%, a difference of 0.51%), and Immigrants from Guyana (14.5%, a difference of 0.68%).
| Demographics | Rating | Rank | Poverty |
| Immigrants | Liberia | 0.1 /100 | #262 | Tragic 14.4% |
| Jamaicans | 0.1 /100 | #263 | Tragic 14.4% |
| Immigrants | Jamaica | 0.1 /100 | #264 | Tragic 14.4% |
| Immigrants | Guyana | 0.1 /100 | #265 | Tragic 14.5% |
| Guyanese | 0.1 /100 | #266 | Tragic 14.5% |
| Iroquois | 0.1 /100 | #267 | Tragic 14.5% |
| Sub-Saharan Africans | 0.1 /100 | #268 | Tragic 14.5% |
| Immigrants | Cuba | 0.1 /100 | #269 | Tragic 14.6% |
| Central Americans | 0.1 /100 | #270 | Tragic 14.6% |
| Shoshone | 0.0 /100 | #271 | Tragic 14.7% |
| Chickasaw | 0.0 /100 | #272 | Tragic 14.7% |
| Spanish Americans | 0.0 /100 | #273 | Tragic 14.7% |
| Barbadians | 0.0 /100 | #274 | Tragic 14.8% |
| Immigrants | West Indies | 0.0 /100 | #275 | Tragic 14.8% |
| Immigrants | Bahamas | 0.0 /100 | #276 | Tragic 14.8% |
Demographics Similar to Ugandans by Poverty
In terms of poverty, the demographic groups most similar to Ugandans are Malaysian (13.1%, a difference of 0.030%), Immigrants from the Azores (13.1%, a difference of 0.060%), Panamanian (13.1%, a difference of 0.15%), Immigrants from Eastern Africa (13.1%, a difference of 0.27%), and Moroccan (13.2%, a difference of 0.42%).
| Demographics | Rating | Rank | Poverty |
| Immigrants | Uganda | 16.5 /100 | #201 | Poor 12.8% |
| Immigrants | Uruguay | 15.6 /100 | #202 | Poor 12.8% |
| Hmong | 15.0 /100 | #203 | Poor 12.8% |
| Immigrants | Western Asia | 14.1 /100 | #204 | Poor 12.9% |
| Tsimshian | 9.2 /100 | #205 | Tragic 13.0% |
| Immigrants | Eastern Africa | 7.0 /100 | #206 | Tragic 13.1% |
| Panamanians | 6.6 /100 | #207 | Tragic 13.1% |
| Ugandans | 6.2 /100 | #208 | Tragic 13.1% |
| Malaysians | 6.1 /100 | #209 | Tragic 13.1% |
| Immigrants | Azores | 6.1 /100 | #210 | Tragic 13.1% |
| Moroccans | 5.2 /100 | #211 | Tragic 13.2% |
| Immigrants | Immigrants | 4.3 /100 | #212 | Tragic 13.2% |
| Immigrants | Panama | 4.1 /100 | #213 | Tragic 13.3% |
| Bermudans | 3.7 /100 | #214 | Tragic 13.3% |
| Japanese | 3.3 /100 | #215 | Tragic 13.3% |