Immigrants from Cuba vs Chilean 10th Grade
COMPARE
Immigrants from Cuba
Chilean
10th Grade
10th Grade Comparison
Immigrants from Cuba
Chileans
90.2%
10TH GRADE
0.0/ 100
METRIC RATING
318th/ 347
METRIC RANK
93.9%
10TH GRADE
70.2/ 100
METRIC RATING
159th/ 347
METRIC RANK
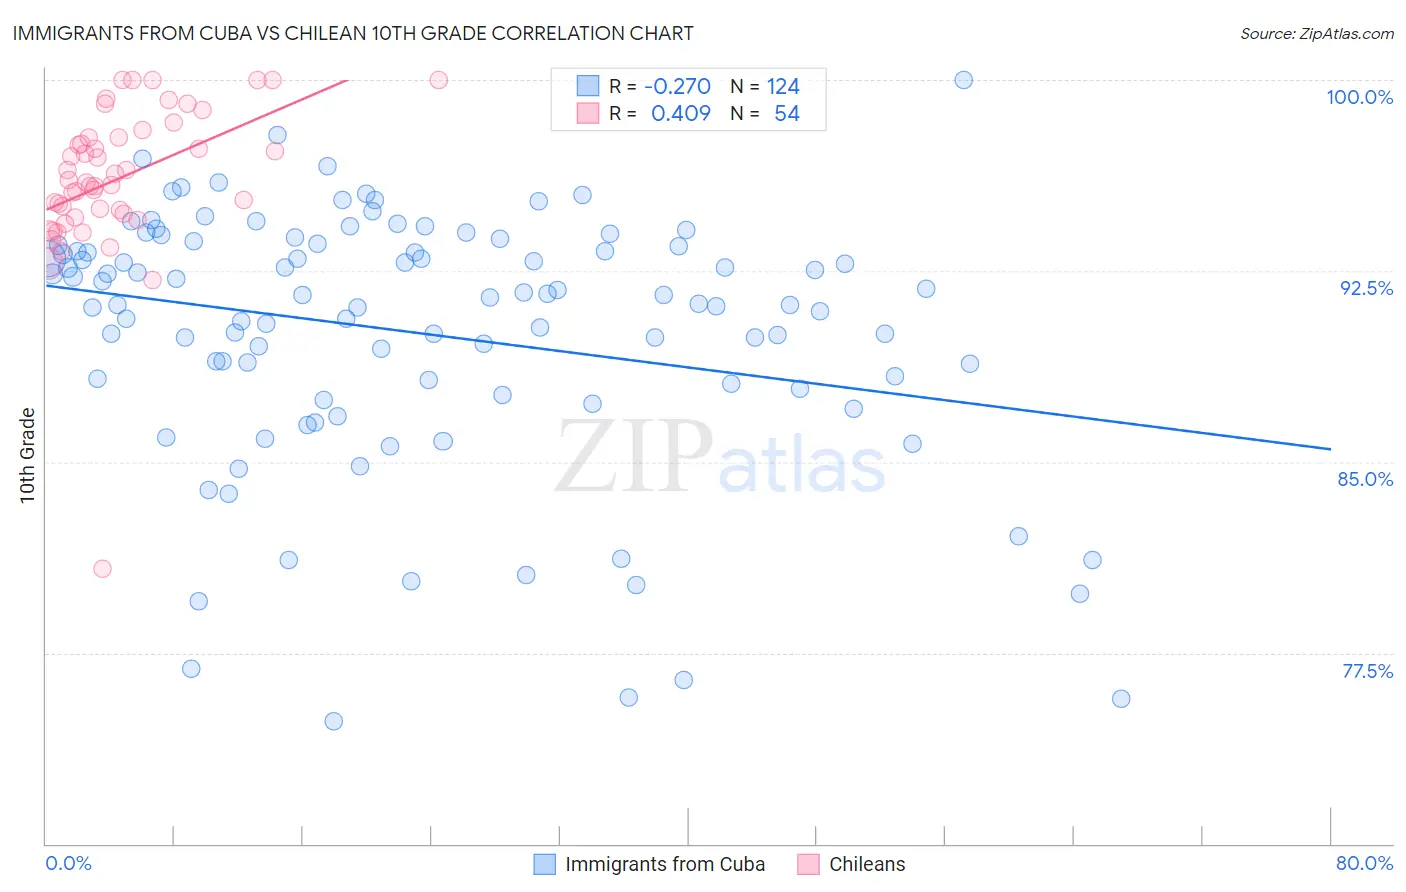
Immigrants from Cuba vs Chilean 10th Grade Correlation Chart
The statistical analysis conducted on geographies consisting of 326,019,170 people shows a weak negative correlation between the proportion of Immigrants from Cuba and percentage of population with at least 10th grade education in the United States with a correlation coefficient (R) of -0.270 and weighted average of 90.2%. Similarly, the statistical analysis conducted on geographies consisting of 256,683,580 people shows a moderate positive correlation between the proportion of Chileans and percentage of population with at least 10th grade education in the United States with a correlation coefficient (R) of 0.409 and weighted average of 93.9%, a difference of 4.1%.
10th Grade Correlation Summary
| Measurement | Immigrants from Cuba | Chilean |
| Minimum | 74.8% | 80.8% |
| Maximum | 100.0% | 100.0% |
| Range | 25.2% | 19.2% |
| Mean | 90.1% | 96.1% |
| Median | 91.3% | 96.0% |
| Interquartile 25% (IQ1) | 88.0% | 94.7% |
| Interquartile 75% (IQ3) | 93.5% | 97.8% |
| Interquartile Range (IQR) | 5.5% | 3.0% |
| Standard Deviation (Sample) | 5.0% | 3.0% |
| Standard Deviation (Population) | 5.0% | 3.0% |
Similar Demographics by 10th Grade
Demographics Similar to Immigrants from Cuba by 10th Grade
In terms of 10th grade, the demographic groups most similar to Immigrants from Cuba are Nicaraguan (90.2%, a difference of 0.080%), Houma (90.2%, a difference of 0.090%), Belizean (90.2%, a difference of 0.090%), Tohono O'odham (90.1%, a difference of 0.10%), and Immigrants from Belize (90.1%, a difference of 0.19%).
| Demographics | Rating | Rank | 10th Grade |
| Immigrants | Cambodia | 0.0 /100 | #311 | Tragic 90.9% |
| Immigrants | Portugal | 0.0 /100 | #312 | Tragic 90.8% |
| Cape Verdeans | 0.0 /100 | #313 | Tragic 90.8% |
| Nepalese | 0.0 /100 | #314 | Tragic 90.7% |
| Immigrants | Caribbean | 0.0 /100 | #315 | Tragic 90.6% |
| Ecuadorians | 0.0 /100 | #316 | Tragic 90.6% |
| Immigrants | Ecuador | 0.0 /100 | #317 | Tragic 90.4% |
| Immigrants | Cuba | 0.0 /100 | #318 | Tragic 90.2% |
| Nicaraguans | 0.0 /100 | #319 | Tragic 90.2% |
| Houma | 0.0 /100 | #320 | Tragic 90.2% |
| Belizeans | 0.0 /100 | #321 | Tragic 90.2% |
| Tohono O'odham | 0.0 /100 | #322 | Tragic 90.1% |
| Immigrants | Belize | 0.0 /100 | #323 | Tragic 90.1% |
| Immigrants | Armenia | 0.0 /100 | #324 | Tragic 89.9% |
| Puerto Ricans | 0.0 /100 | #325 | Tragic 89.8% |
Demographics Similar to Chileans by 10th Grade
In terms of 10th grade, the demographic groups most similar to Chileans are Pakistani (93.9%, a difference of 0.0%), Bermudan (93.9%, a difference of 0.010%), Assyrian/Chaldean/Syriac (93.9%, a difference of 0.010%), Immigrants from Poland (93.9%, a difference of 0.010%), and Venezuelan (93.9%, a difference of 0.010%).
| Demographics | Rating | Rank | 10th Grade |
| Immigrants | Italy | 78.0 /100 | #152 | Good 94.0% |
| Immigrants | Brazil | 75.5 /100 | #153 | Good 94.0% |
| Immigrants | Kenya | 75.3 /100 | #154 | Good 94.0% |
| Spanish | 74.9 /100 | #155 | Good 94.0% |
| Mongolians | 74.4 /100 | #156 | Good 94.0% |
| Kiowa | 73.3 /100 | #157 | Good 93.9% |
| Bermudans | 71.0 /100 | #158 | Good 93.9% |
| Chileans | 70.2 /100 | #159 | Good 93.9% |
| Pakistanis | 70.1 /100 | #160 | Good 93.9% |
| Assyrians/Chaldeans/Syriacs | 69.7 /100 | #161 | Good 93.9% |
| Immigrants | Poland | 69.6 /100 | #162 | Good 93.9% |
| Venezuelans | 69.5 /100 | #163 | Good 93.9% |
| Iraqis | 68.1 /100 | #164 | Good 93.9% |
| Brazilians | 63.6 /100 | #165 | Good 93.8% |
| Immigrants | Iraq | 63.0 /100 | #166 | Good 93.8% |