Immigrants from China vs Choctaw Receiving Food Stamps
COMPARE
Immigrants from China
Choctaw
Receiving Food Stamps
Receiving Food Stamps Comparison
Immigrants from China
Choctaw
9.6%
RECEIVING FOOD STAMPS
99.5/ 100
METRIC RATING
42nd/ 347
METRIC RANK
13.6%
RECEIVING FOOD STAMPS
1.0/ 100
METRIC RATING
241st/ 347
METRIC RANK
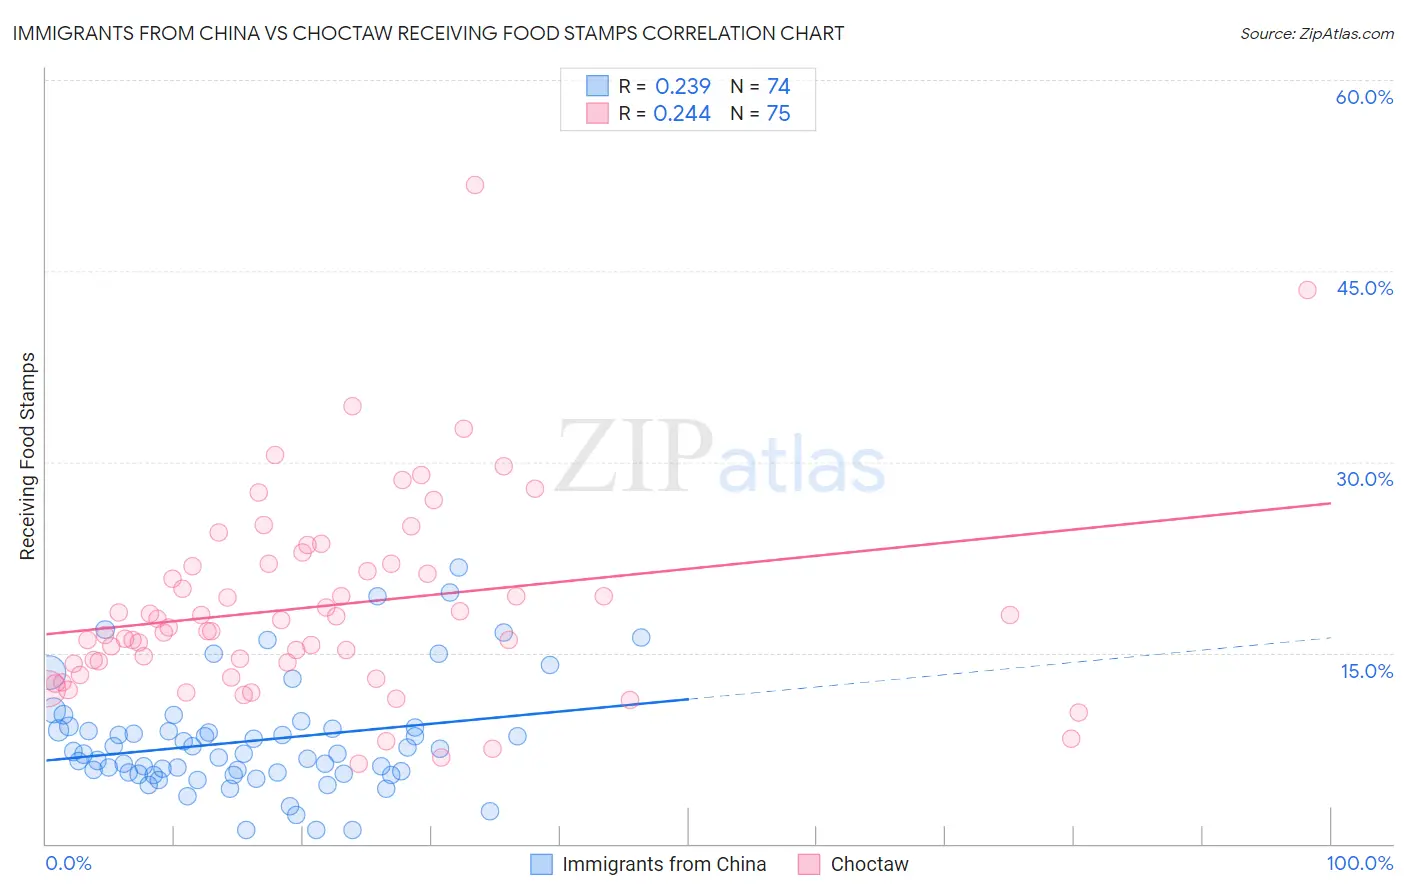
Immigrants from China vs Choctaw Receiving Food Stamps Correlation Chart
The statistical analysis conducted on geographies consisting of 454,770,317 people shows a weak positive correlation between the proportion of Immigrants from China and percentage of population receiving government assistance and/or food stamps in the United States with a correlation coefficient (R) of 0.239 and weighted average of 9.6%. Similarly, the statistical analysis conducted on geographies consisting of 269,484,151 people shows a weak positive correlation between the proportion of Choctaw and percentage of population receiving government assistance and/or food stamps in the United States with a correlation coefficient (R) of 0.244 and weighted average of 13.6%, a difference of 42.3%.
Receiving Food Stamps Correlation Summary
| Measurement | Immigrants from China | Choctaw |
| Minimum | 1.1% | 6.3% |
| Maximum | 21.7% | 51.8% |
| Range | 20.6% | 45.5% |
| Mean | 8.1% | 18.7% |
| Median | 7.1% | 17.0% |
| Interquartile 25% (IQ1) | 5.5% | 14.1% |
| Interquartile 75% (IQ3) | 9.1% | 22.0% |
| Interquartile Range (IQR) | 3.6% | 7.9% |
| Standard Deviation (Sample) | 4.3% | 7.8% |
| Standard Deviation (Population) | 4.3% | 7.8% |
Similar Demographics by Receiving Food Stamps
Demographics Similar to Immigrants from China by Receiving Food Stamps
In terms of receiving food stamps, the demographic groups most similar to Immigrants from China are Cambodian (9.5%, a difference of 0.25%), Croatian (9.6%, a difference of 0.30%), Immigrants from Netherlands (9.5%, a difference of 0.42%), Immigrants from Bolivia (9.5%, a difference of 0.43%), and Immigrants from Sri Lanka (9.5%, a difference of 0.44%).
| Demographics | Rating | Rank | Receiving Food Stamps |
| Immigrants | Austria | 99.6 /100 | #35 | Exceptional 9.5% |
| Estonians | 99.6 /100 | #36 | Exceptional 9.5% |
| Europeans | 99.6 /100 | #37 | Exceptional 9.5% |
| Immigrants | Sri Lanka | 99.5 /100 | #38 | Exceptional 9.5% |
| Immigrants | Bolivia | 99.5 /100 | #39 | Exceptional 9.5% |
| Immigrants | Netherlands | 99.5 /100 | #40 | Exceptional 9.5% |
| Cambodians | 99.5 /100 | #41 | Exceptional 9.5% |
| Immigrants | China | 99.5 /100 | #42 | Exceptional 9.6% |
| Croatians | 99.5 /100 | #43 | Exceptional 9.6% |
| Immigrants | Denmark | 99.4 /100 | #44 | Exceptional 9.6% |
| Immigrants | Belgium | 99.4 /100 | #45 | Exceptional 9.6% |
| Australians | 99.4 /100 | #46 | Exceptional 9.6% |
| Indians (Asian) | 99.4 /100 | #47 | Exceptional 9.6% |
| Russians | 99.4 /100 | #48 | Exceptional 9.6% |
| Immigrants | Czechoslovakia | 99.4 /100 | #49 | Exceptional 9.6% |
Demographics Similar to Choctaw by Receiving Food Stamps
In terms of receiving food stamps, the demographic groups most similar to Choctaw are Immigrants from Panama (13.6%, a difference of 0.18%), Somali (13.7%, a difference of 0.38%), Iroquois (13.5%, a difference of 0.43%), Cajun (13.7%, a difference of 0.54%), and Immigrants from Somalia (13.7%, a difference of 0.58%).
| Demographics | Rating | Rank | Receiving Food Stamps |
| Comanche | 2.4 /100 | #234 | Tragic 13.3% |
| Immigrants | Zaire | 1.9 /100 | #235 | Tragic 13.4% |
| Crow | 1.6 /100 | #236 | Tragic 13.4% |
| Immigrants | El Salvador | 1.5 /100 | #237 | Tragic 13.5% |
| French American Indians | 1.4 /100 | #238 | Tragic 13.5% |
| Immigrants | Micronesia | 1.3 /100 | #239 | Tragic 13.5% |
| Iroquois | 1.2 /100 | #240 | Tragic 13.5% |
| Choctaw | 1.0 /100 | #241 | Tragic 13.6% |
| Immigrants | Panama | 1.0 /100 | #242 | Tragic 13.6% |
| Somalis | 0.9 /100 | #243 | Tragic 13.7% |
| Cajuns | 0.9 /100 | #244 | Tragic 13.7% |
| Immigrants | Somalia | 0.9 /100 | #245 | Tragic 13.7% |
| Cree | 0.8 /100 | #246 | Tragic 13.7% |
| Mexican American Indians | 0.7 /100 | #247 | Tragic 13.8% |
| Immigrants | Laos | 0.7 /100 | #248 | Tragic 13.8% |