Marshallese vs Choctaw Receiving Food Stamps
COMPARE
Marshallese
Choctaw
Receiving Food Stamps
Receiving Food Stamps Comparison
Marshallese
Choctaw
14.1%
RECEIVING FOOD STAMPS
0.3/ 100
METRIC RATING
254th/ 347
METRIC RANK
13.6%
RECEIVING FOOD STAMPS
1.0/ 100
METRIC RATING
241st/ 347
METRIC RANK
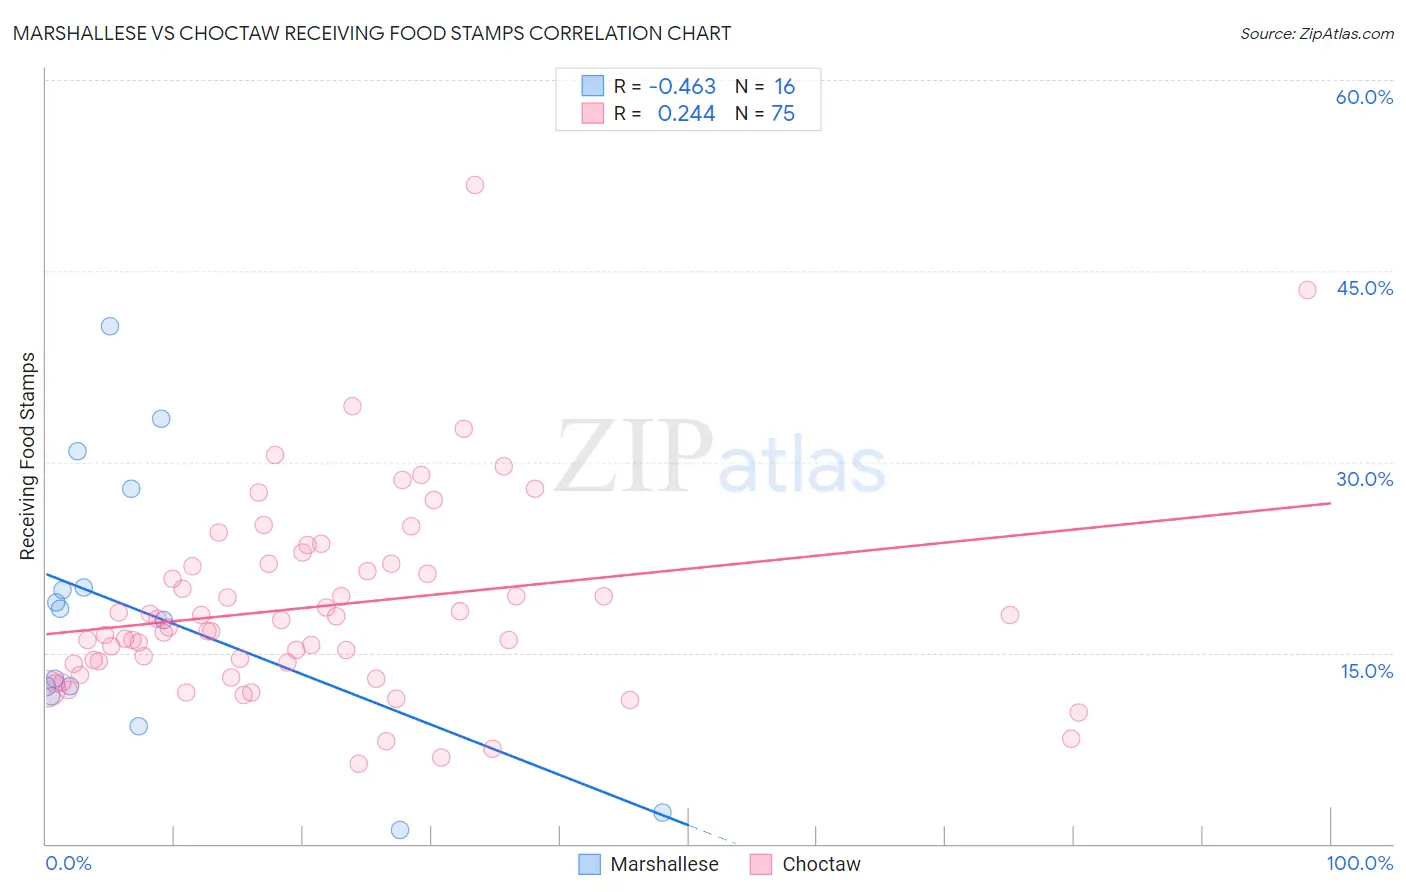
Marshallese vs Choctaw Receiving Food Stamps Correlation Chart
The statistical analysis conducted on geographies consisting of 14,761,315 people shows a moderate negative correlation between the proportion of Marshallese and percentage of population receiving government assistance and/or food stamps in the United States with a correlation coefficient (R) of -0.463 and weighted average of 14.1%. Similarly, the statistical analysis conducted on geographies consisting of 269,484,151 people shows a weak positive correlation between the proportion of Choctaw and percentage of population receiving government assistance and/or food stamps in the United States with a correlation coefficient (R) of 0.244 and weighted average of 13.6%, a difference of 3.5%.
Receiving Food Stamps Correlation Summary
| Measurement | Marshallese | Choctaw |
| Minimum | 1.1% | 6.3% |
| Maximum | 40.7% | 51.8% |
| Range | 39.6% | 45.5% |
| Mean | 18.1% | 18.7% |
| Median | 18.0% | 17.0% |
| Interquartile 25% (IQ1) | 12.0% | 14.1% |
| Interquartile 75% (IQ3) | 24.0% | 22.0% |
| Interquartile Range (IQR) | 12.0% | 7.9% |
| Standard Deviation (Sample) | 10.8% | 7.8% |
| Standard Deviation (Population) | 10.5% | 7.8% |
Demographics Similar to Marshallese and Choctaw by Receiving Food Stamps
In terms of receiving food stamps, the demographic groups most similar to Marshallese are Subsaharan African (14.1%, a difference of 0.010%), Japanese (14.1%, a difference of 0.030%), Arapaho (14.1%, a difference of 0.14%), Spanish American (14.0%, a difference of 0.60%), and Ghanaian (14.0%, a difference of 0.97%). Similarly, the demographic groups most similar to Choctaw are Immigrants from Panama (13.6%, a difference of 0.18%), Somali (13.7%, a difference of 0.38%), Iroquois (13.5%, a difference of 0.43%), Cajun (13.7%, a difference of 0.54%), and Immigrants from Somalia (13.7%, a difference of 0.58%).
| Demographics | Rating | Rank | Receiving Food Stamps |
| Immigrants | El Salvador | 1.5 /100 | #237 | Tragic 13.5% |
| French American Indians | 1.4 /100 | #238 | Tragic 13.5% |
| Immigrants | Micronesia | 1.3 /100 | #239 | Tragic 13.5% |
| Iroquois | 1.2 /100 | #240 | Tragic 13.5% |
| Choctaw | 1.0 /100 | #241 | Tragic 13.6% |
| Immigrants | Panama | 1.0 /100 | #242 | Tragic 13.6% |
| Somalis | 0.9 /100 | #243 | Tragic 13.7% |
| Cajuns | 0.9 /100 | #244 | Tragic 13.7% |
| Immigrants | Somalia | 0.9 /100 | #245 | Tragic 13.7% |
| Cree | 0.8 /100 | #246 | Tragic 13.7% |
| Mexican American Indians | 0.7 /100 | #247 | Tragic 13.8% |
| Immigrants | Laos | 0.7 /100 | #248 | Tragic 13.8% |
| Indonesians | 0.6 /100 | #249 | Tragic 13.9% |
| Immigrants | Cambodia | 0.5 /100 | #250 | Tragic 13.9% |
| Yaqui | 0.5 /100 | #251 | Tragic 13.9% |
| Ghanaians | 0.5 /100 | #252 | Tragic 14.0% |
| Spanish Americans | 0.4 /100 | #253 | Tragic 14.0% |
| Marshallese | 0.3 /100 | #254 | Tragic 14.1% |
| Sub-Saharan Africans | 0.3 /100 | #255 | Tragic 14.1% |
| Japanese | 0.3 /100 | #256 | Tragic 14.1% |
| Arapaho | 0.3 /100 | #257 | Tragic 14.1% |