Paraguayan vs Choctaw Receiving Food Stamps
COMPARE
Paraguayan
Choctaw
Receiving Food Stamps
Receiving Food Stamps Comparison
Paraguayans
Choctaw
10.7%
RECEIVING FOOD STAMPS
93.0/ 100
METRIC RATING
124th/ 347
METRIC RANK
13.6%
RECEIVING FOOD STAMPS
1.0/ 100
METRIC RATING
241st/ 347
METRIC RANK
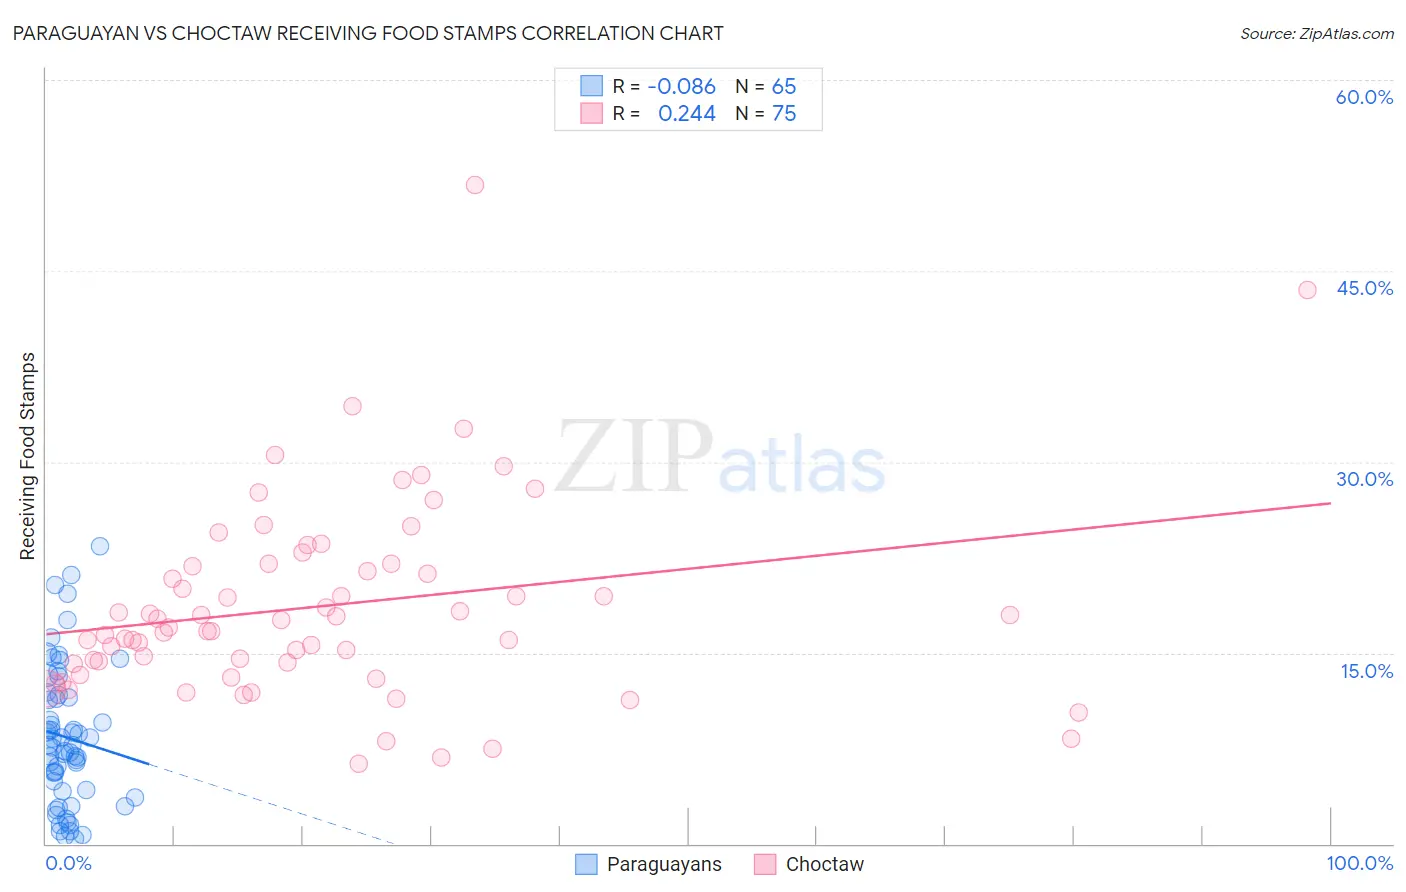
Paraguayan vs Choctaw Receiving Food Stamps Correlation Chart
The statistical analysis conducted on geographies consisting of 95,051,783 people shows a slight negative correlation between the proportion of Paraguayans and percentage of population receiving government assistance and/or food stamps in the United States with a correlation coefficient (R) of -0.086 and weighted average of 10.7%. Similarly, the statistical analysis conducted on geographies consisting of 269,484,151 people shows a weak positive correlation between the proportion of Choctaw and percentage of population receiving government assistance and/or food stamps in the United States with a correlation coefficient (R) of 0.244 and weighted average of 13.6%, a difference of 27.5%.
Receiving Food Stamps Correlation Summary
| Measurement | Paraguayan | Choctaw |
| Minimum | 0.40% | 6.3% |
| Maximum | 23.4% | 51.8% |
| Range | 23.0% | 45.5% |
| Mean | 8.4% | 18.7% |
| Median | 7.8% | 17.0% |
| Interquartile 25% (IQ1) | 4.2% | 14.1% |
| Interquartile 75% (IQ3) | 11.6% | 22.0% |
| Interquartile Range (IQR) | 7.4% | 7.9% |
| Standard Deviation (Sample) | 5.4% | 7.8% |
| Standard Deviation (Population) | 5.4% | 7.8% |
Similar Demographics by Receiving Food Stamps
Demographics Similar to Paraguayans by Receiving Food Stamps
In terms of receiving food stamps, the demographic groups most similar to Paraguayans are Ukrainian (10.7%, a difference of 0.080%), Immigrants from Philippines (10.7%, a difference of 0.21%), Afghan (10.7%, a difference of 0.22%), Immigrants from Ethiopia (10.7%, a difference of 0.25%), and Immigrants from Jordan (10.7%, a difference of 0.26%).
| Demographics | Rating | Rank | Receiving Food Stamps |
| Immigrants | Nepal | 94.6 /100 | #117 | Exceptional 10.6% |
| Assyrians/Chaldeans/Syriacs | 94.1 /100 | #118 | Exceptional 10.6% |
| Immigrants | Poland | 93.9 /100 | #119 | Exceptional 10.6% |
| Ethiopians | 93.9 /100 | #120 | Exceptional 10.6% |
| Slavs | 93.8 /100 | #121 | Exceptional 10.6% |
| Sri Lankans | 93.7 /100 | #122 | Exceptional 10.6% |
| Immigrants | Philippines | 93.3 /100 | #123 | Exceptional 10.7% |
| Paraguayans | 93.0 /100 | #124 | Exceptional 10.7% |
| Ukrainians | 92.8 /100 | #125 | Exceptional 10.7% |
| Afghans | 92.6 /100 | #126 | Exceptional 10.7% |
| Immigrants | Ethiopia | 92.6 /100 | #127 | Exceptional 10.7% |
| Immigrants | Jordan | 92.5 /100 | #128 | Exceptional 10.7% |
| Yugoslavians | 92.5 /100 | #129 | Exceptional 10.7% |
| Israelis | 92.4 /100 | #130 | Exceptional 10.7% |
| French | 92.3 /100 | #131 | Exceptional 10.7% |
Demographics Similar to Choctaw by Receiving Food Stamps
In terms of receiving food stamps, the demographic groups most similar to Choctaw are Immigrants from Panama (13.6%, a difference of 0.18%), Somali (13.7%, a difference of 0.38%), Iroquois (13.5%, a difference of 0.43%), Cajun (13.7%, a difference of 0.54%), and Immigrants from Somalia (13.7%, a difference of 0.58%).
| Demographics | Rating | Rank | Receiving Food Stamps |
| Comanche | 2.4 /100 | #234 | Tragic 13.3% |
| Immigrants | Zaire | 1.9 /100 | #235 | Tragic 13.4% |
| Crow | 1.6 /100 | #236 | Tragic 13.4% |
| Immigrants | El Salvador | 1.5 /100 | #237 | Tragic 13.5% |
| French American Indians | 1.4 /100 | #238 | Tragic 13.5% |
| Immigrants | Micronesia | 1.3 /100 | #239 | Tragic 13.5% |
| Iroquois | 1.2 /100 | #240 | Tragic 13.5% |
| Choctaw | 1.0 /100 | #241 | Tragic 13.6% |
| Immigrants | Panama | 1.0 /100 | #242 | Tragic 13.6% |
| Somalis | 0.9 /100 | #243 | Tragic 13.7% |
| Cajuns | 0.9 /100 | #244 | Tragic 13.7% |
| Immigrants | Somalia | 0.9 /100 | #245 | Tragic 13.7% |
| Cree | 0.8 /100 | #246 | Tragic 13.7% |
| Mexican American Indians | 0.7 /100 | #247 | Tragic 13.8% |
| Immigrants | Laos | 0.7 /100 | #248 | Tragic 13.8% |